Plots
Voiager produces several figures to visualize the input data and the inferred results, these are all stored in the results/ folder.
Catalog properties
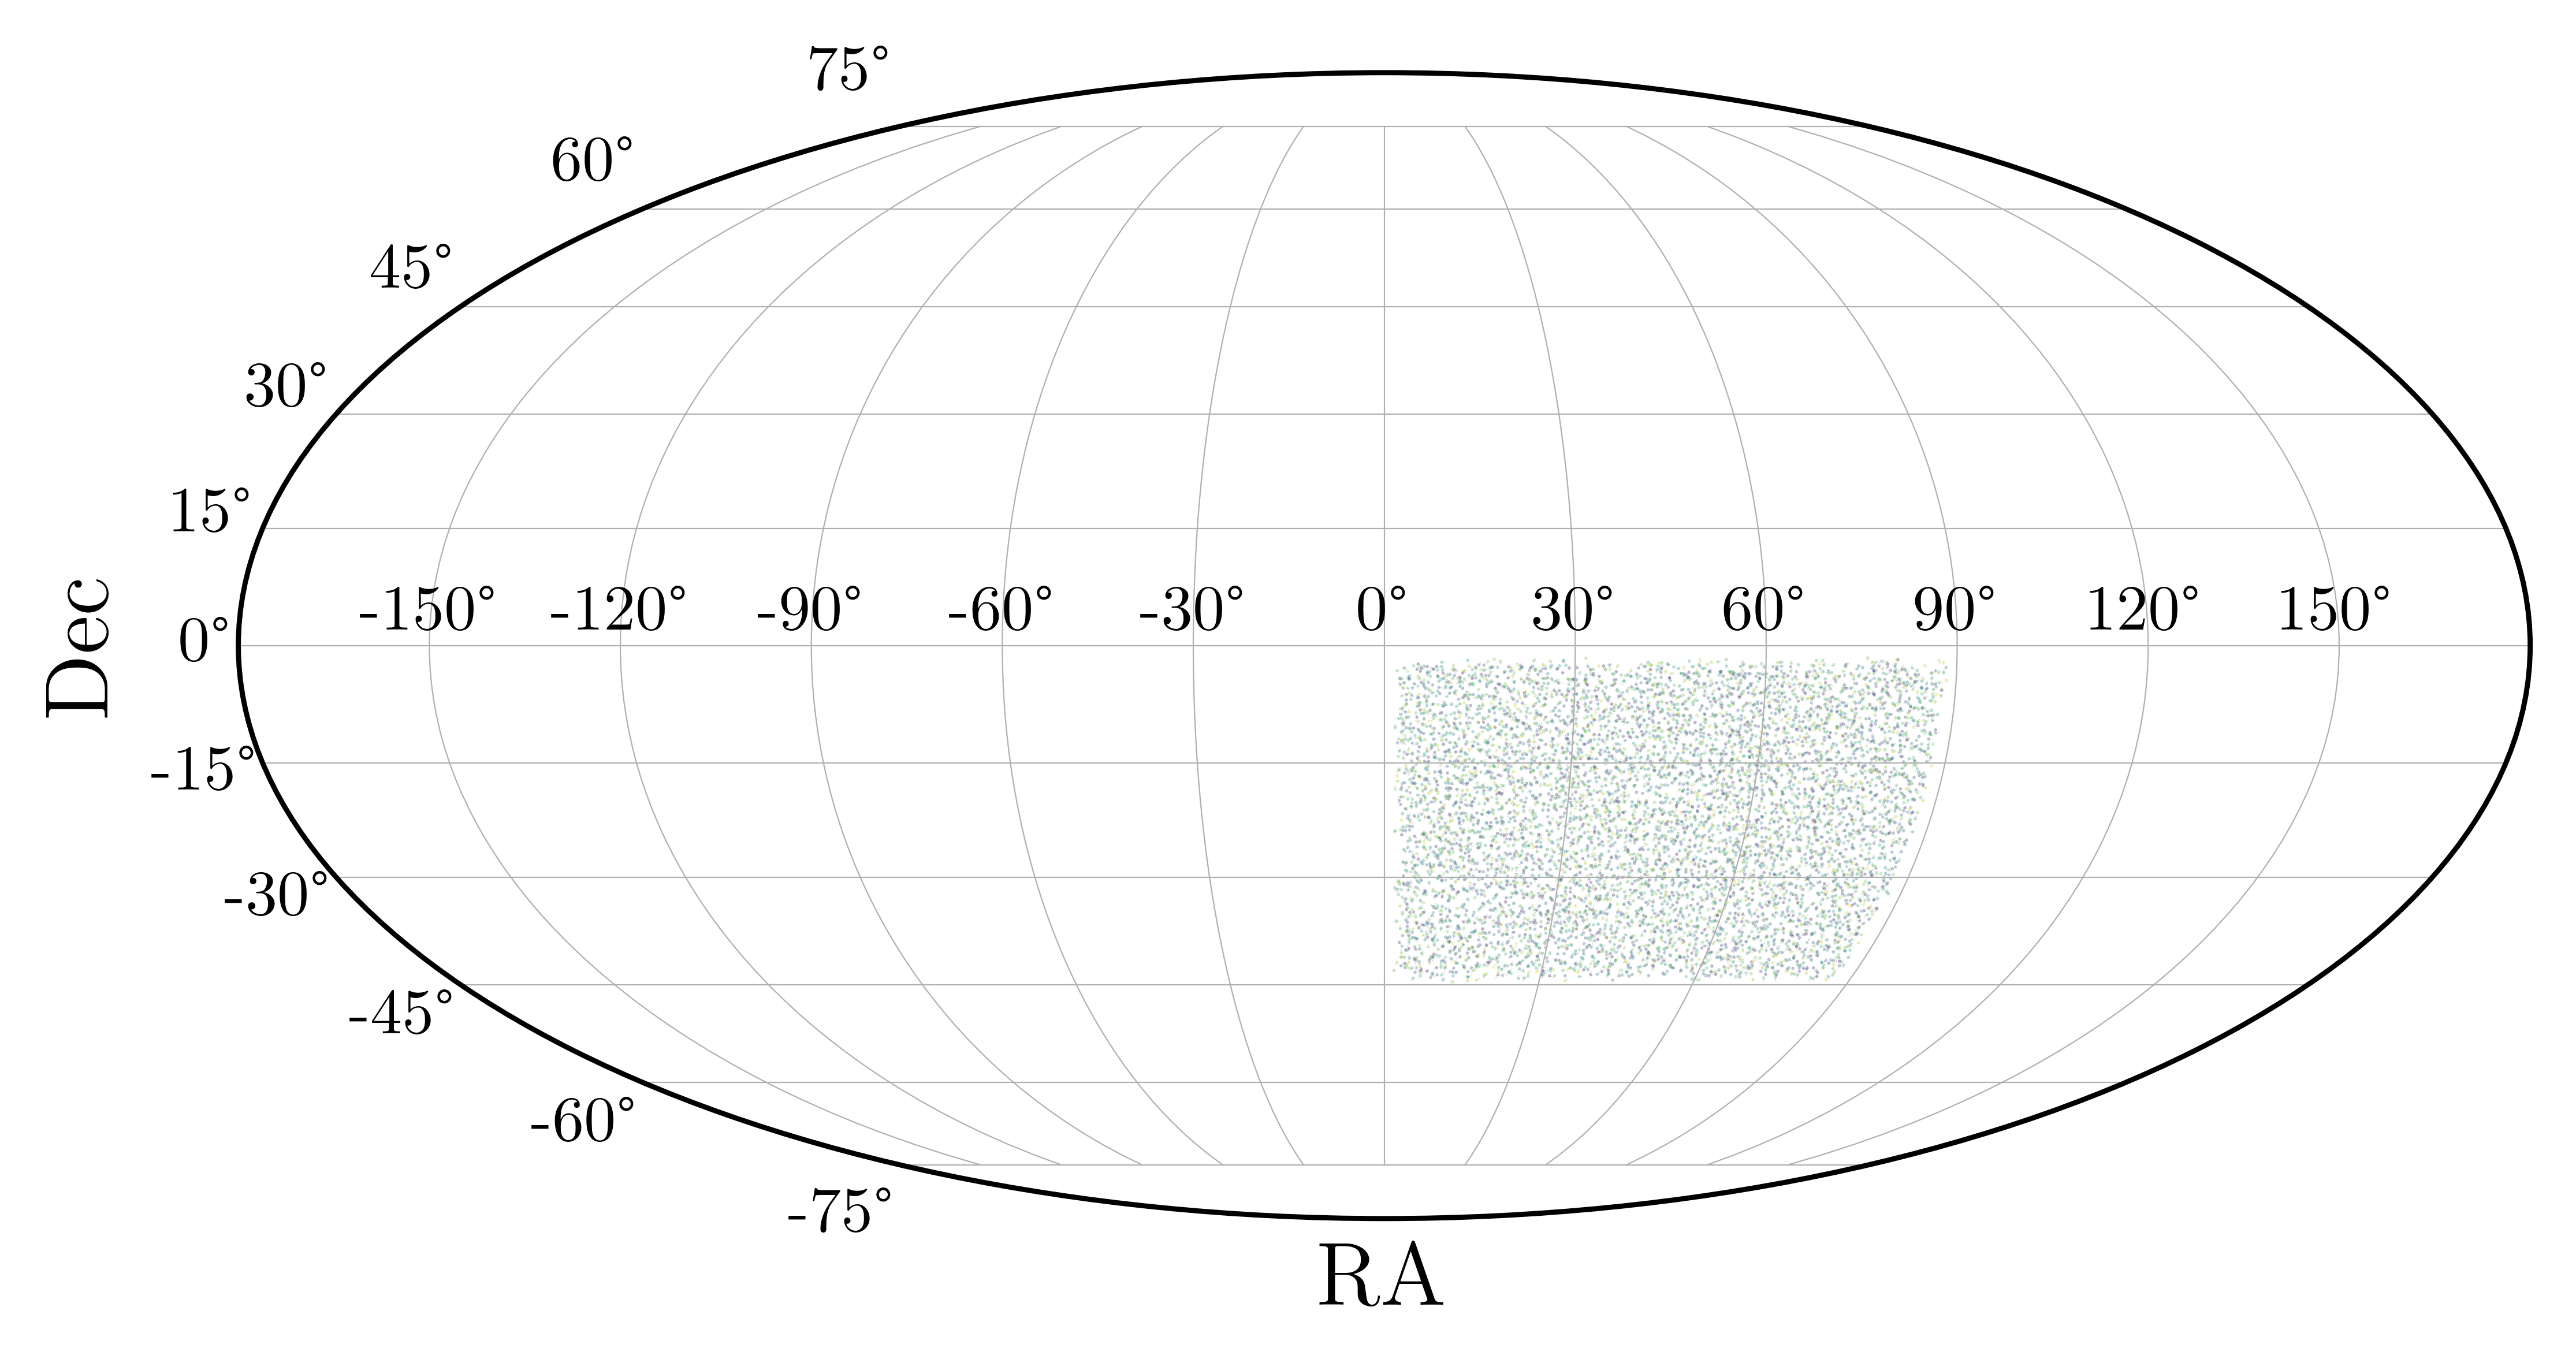
The file named void_sky contains a Mollweide projection of the angular distribution of void centers on the sky, color-coded by redshift.
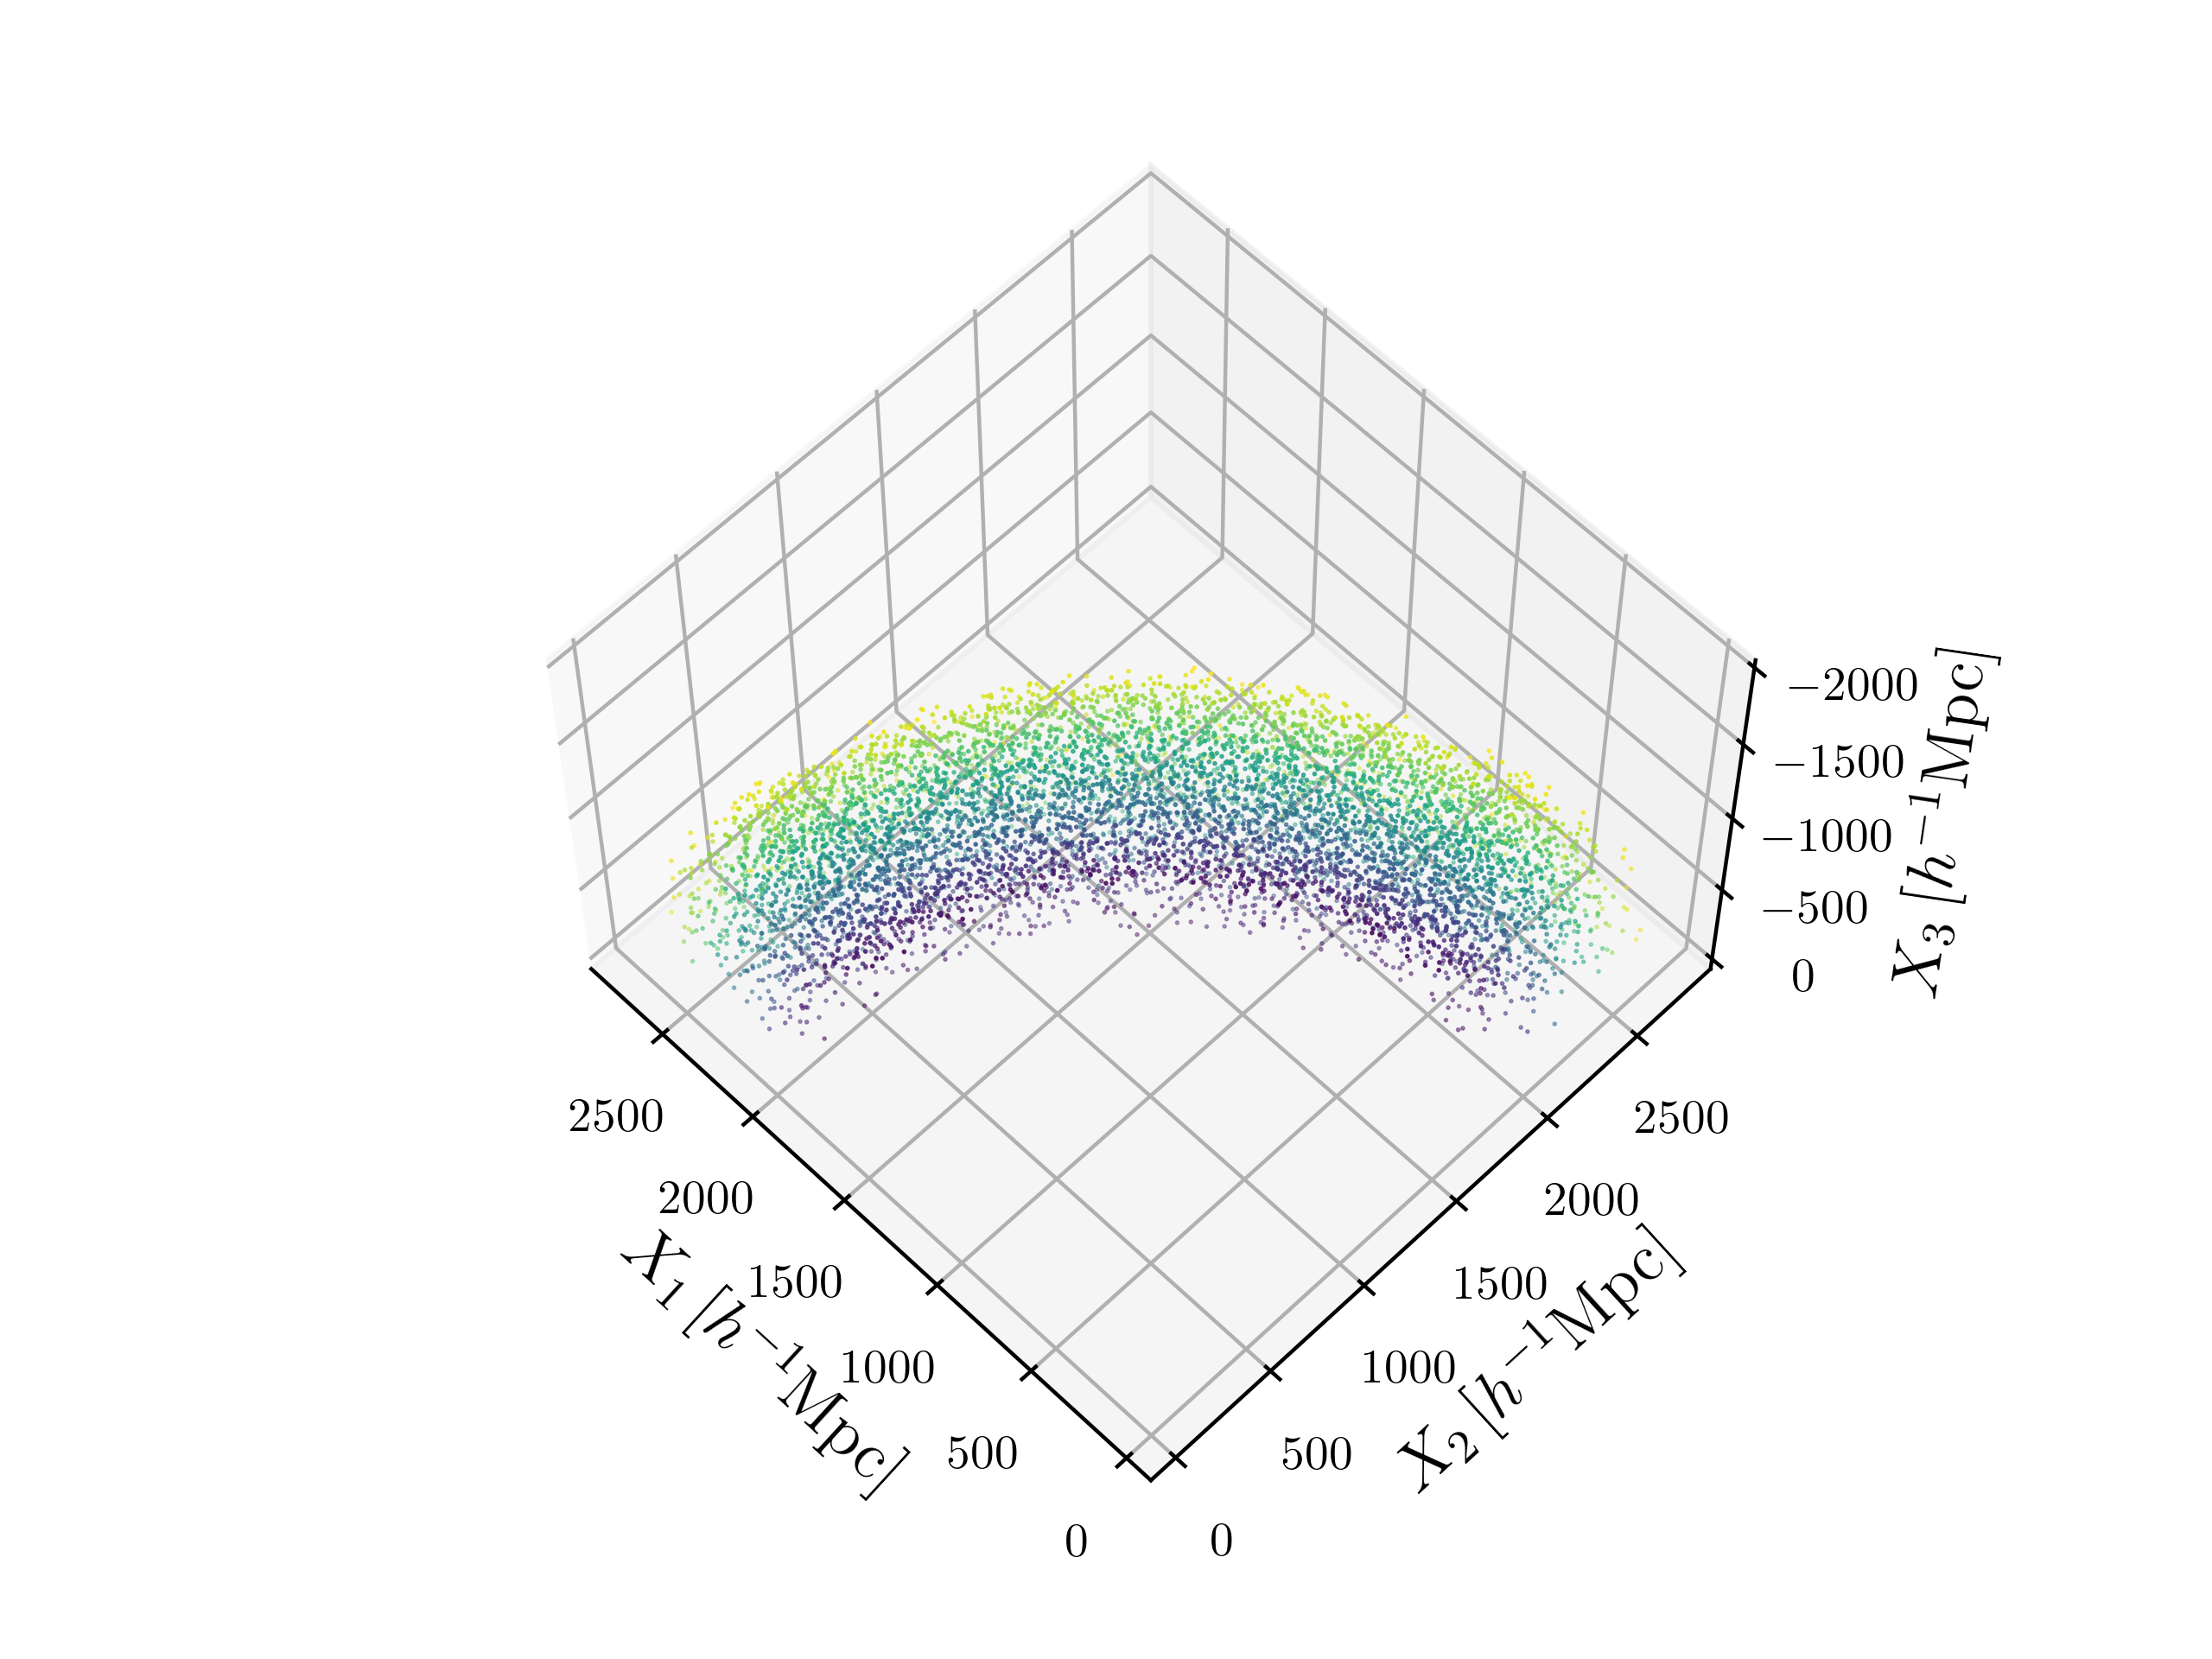
In the file void_box the same void centers are shown in a Cartesian (comoving) coordinate system.
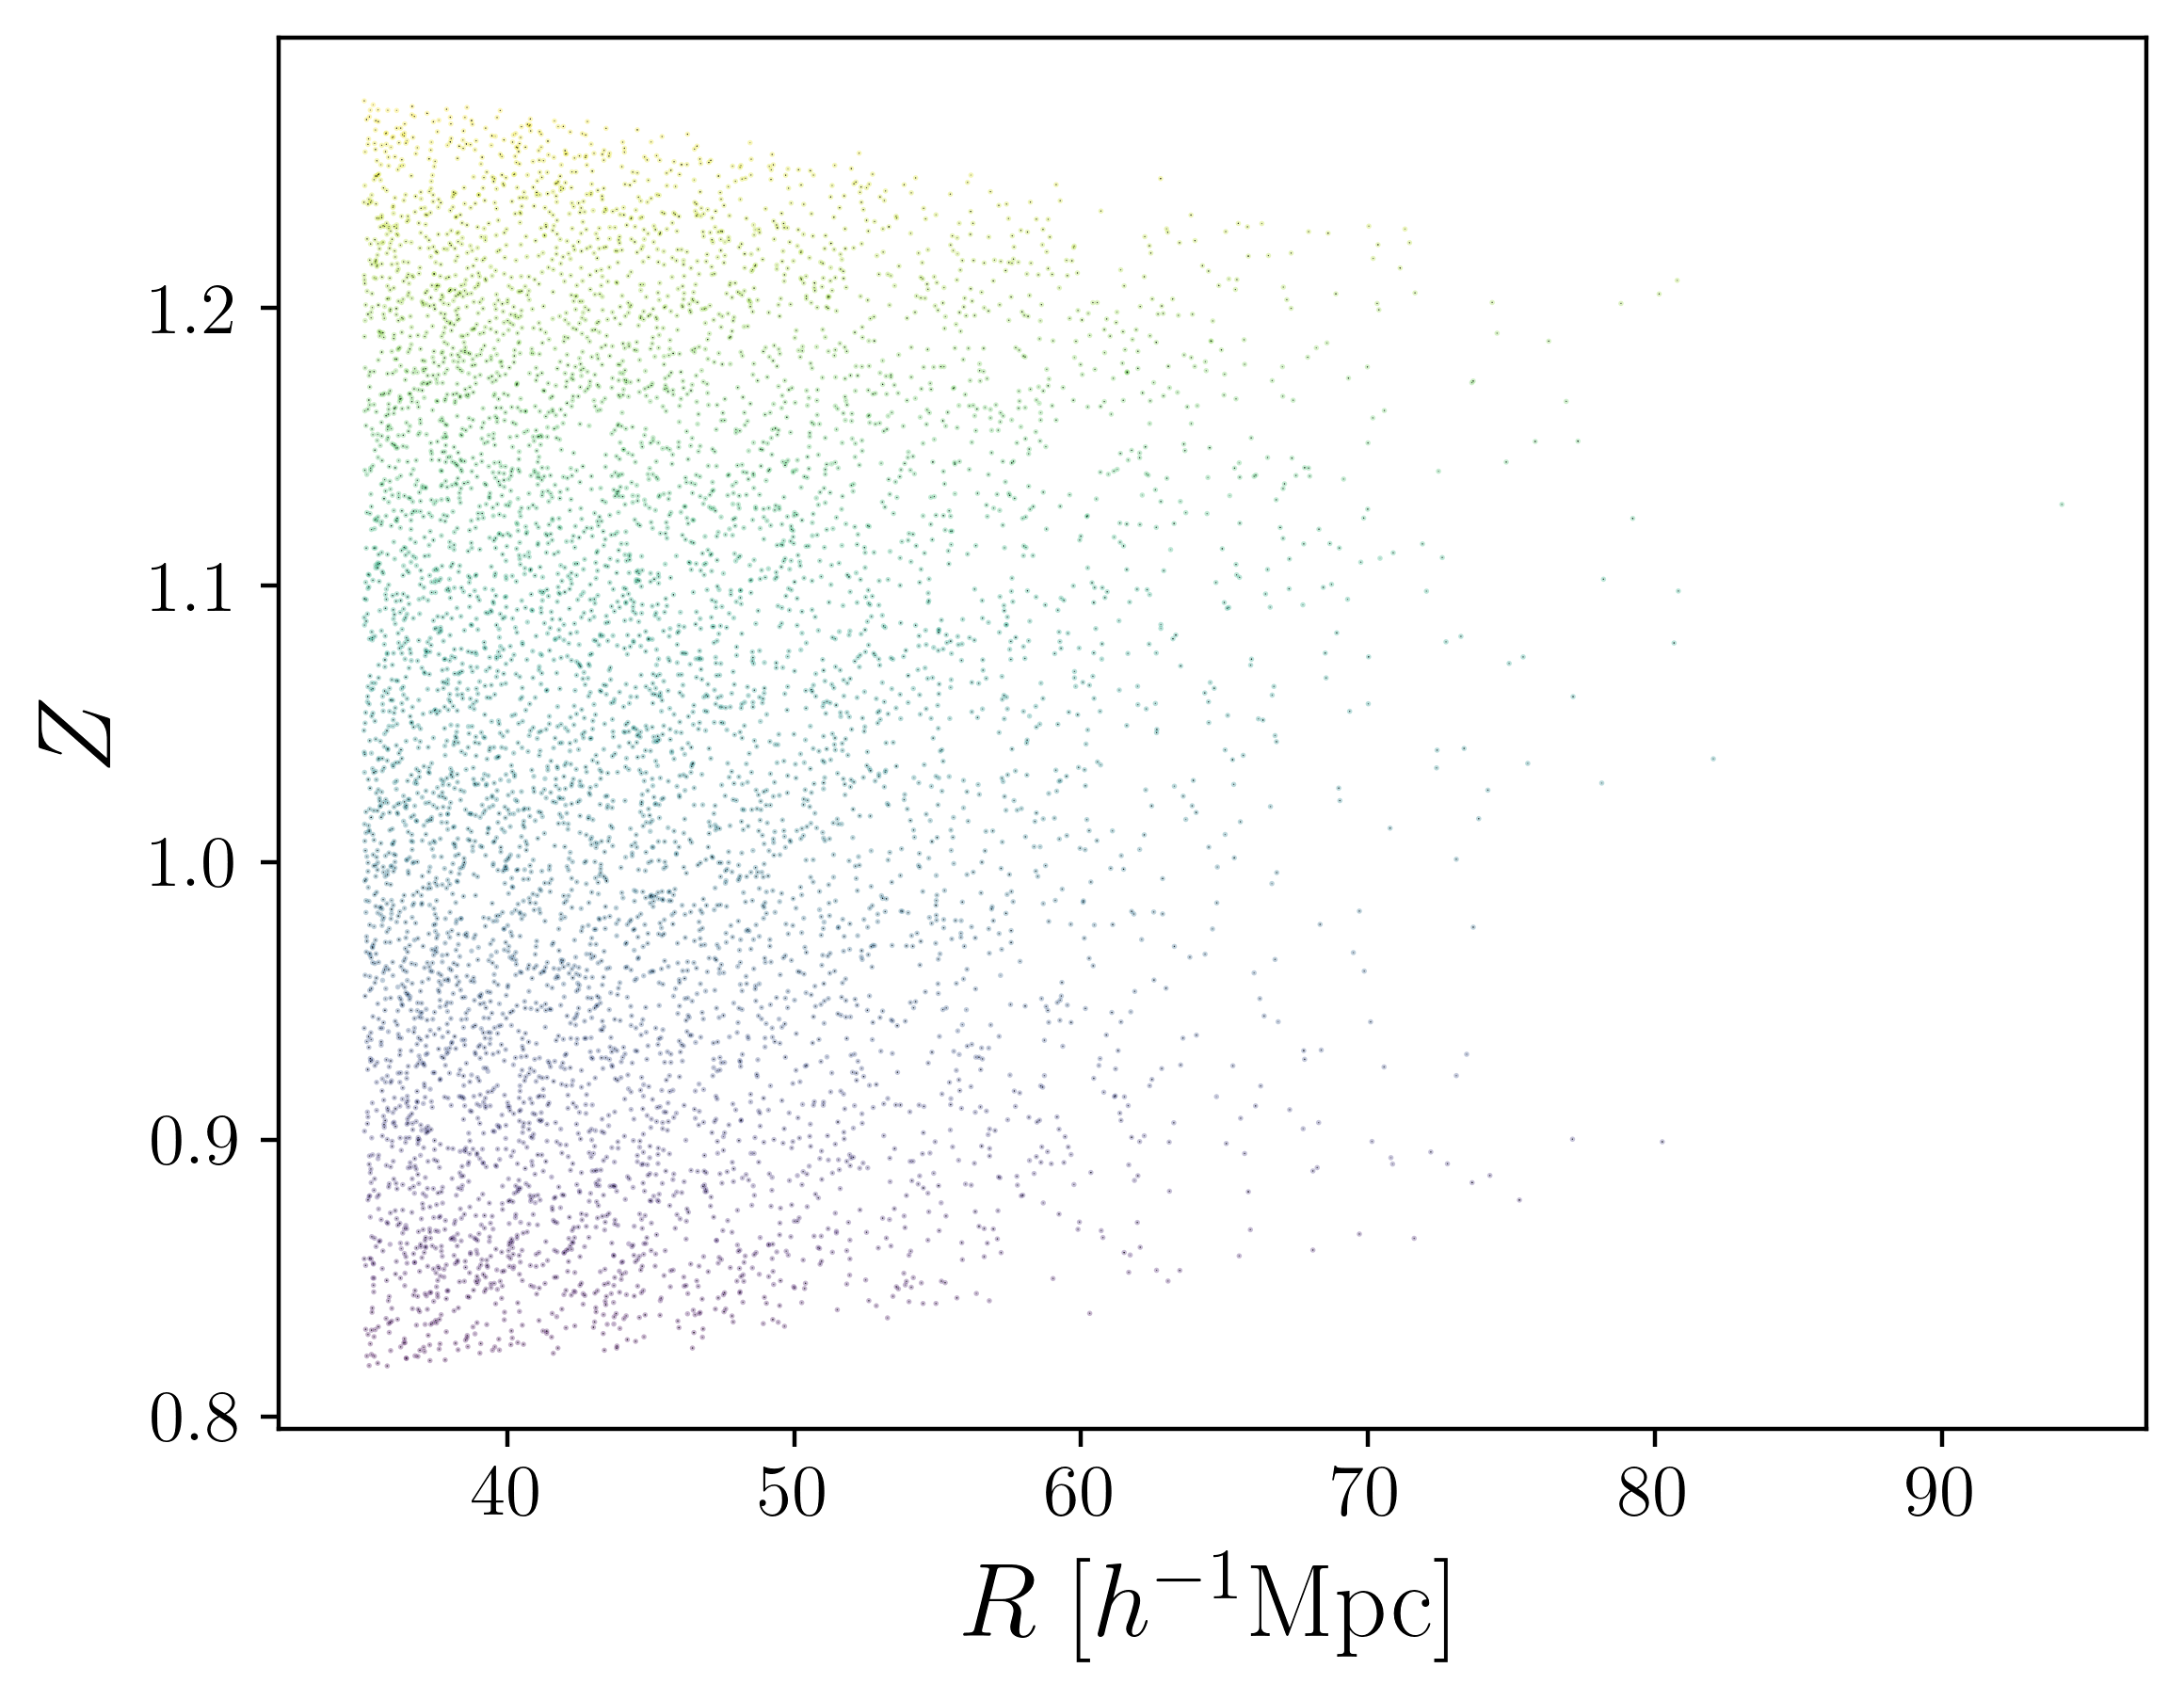
void_redshift is a scatter plot of the effective radius vs. the redshift of each void in the catalog.
Void abundance
The most basic void features can be summarized via distributions. These are typically expressed as number densities per logarithmic interval of the void property. The file names start with n_, followed by one of the following properties: compensation, core-density, density-contrast, effective-radius, ellipticity, redshift, richness. Some examples are shown below:
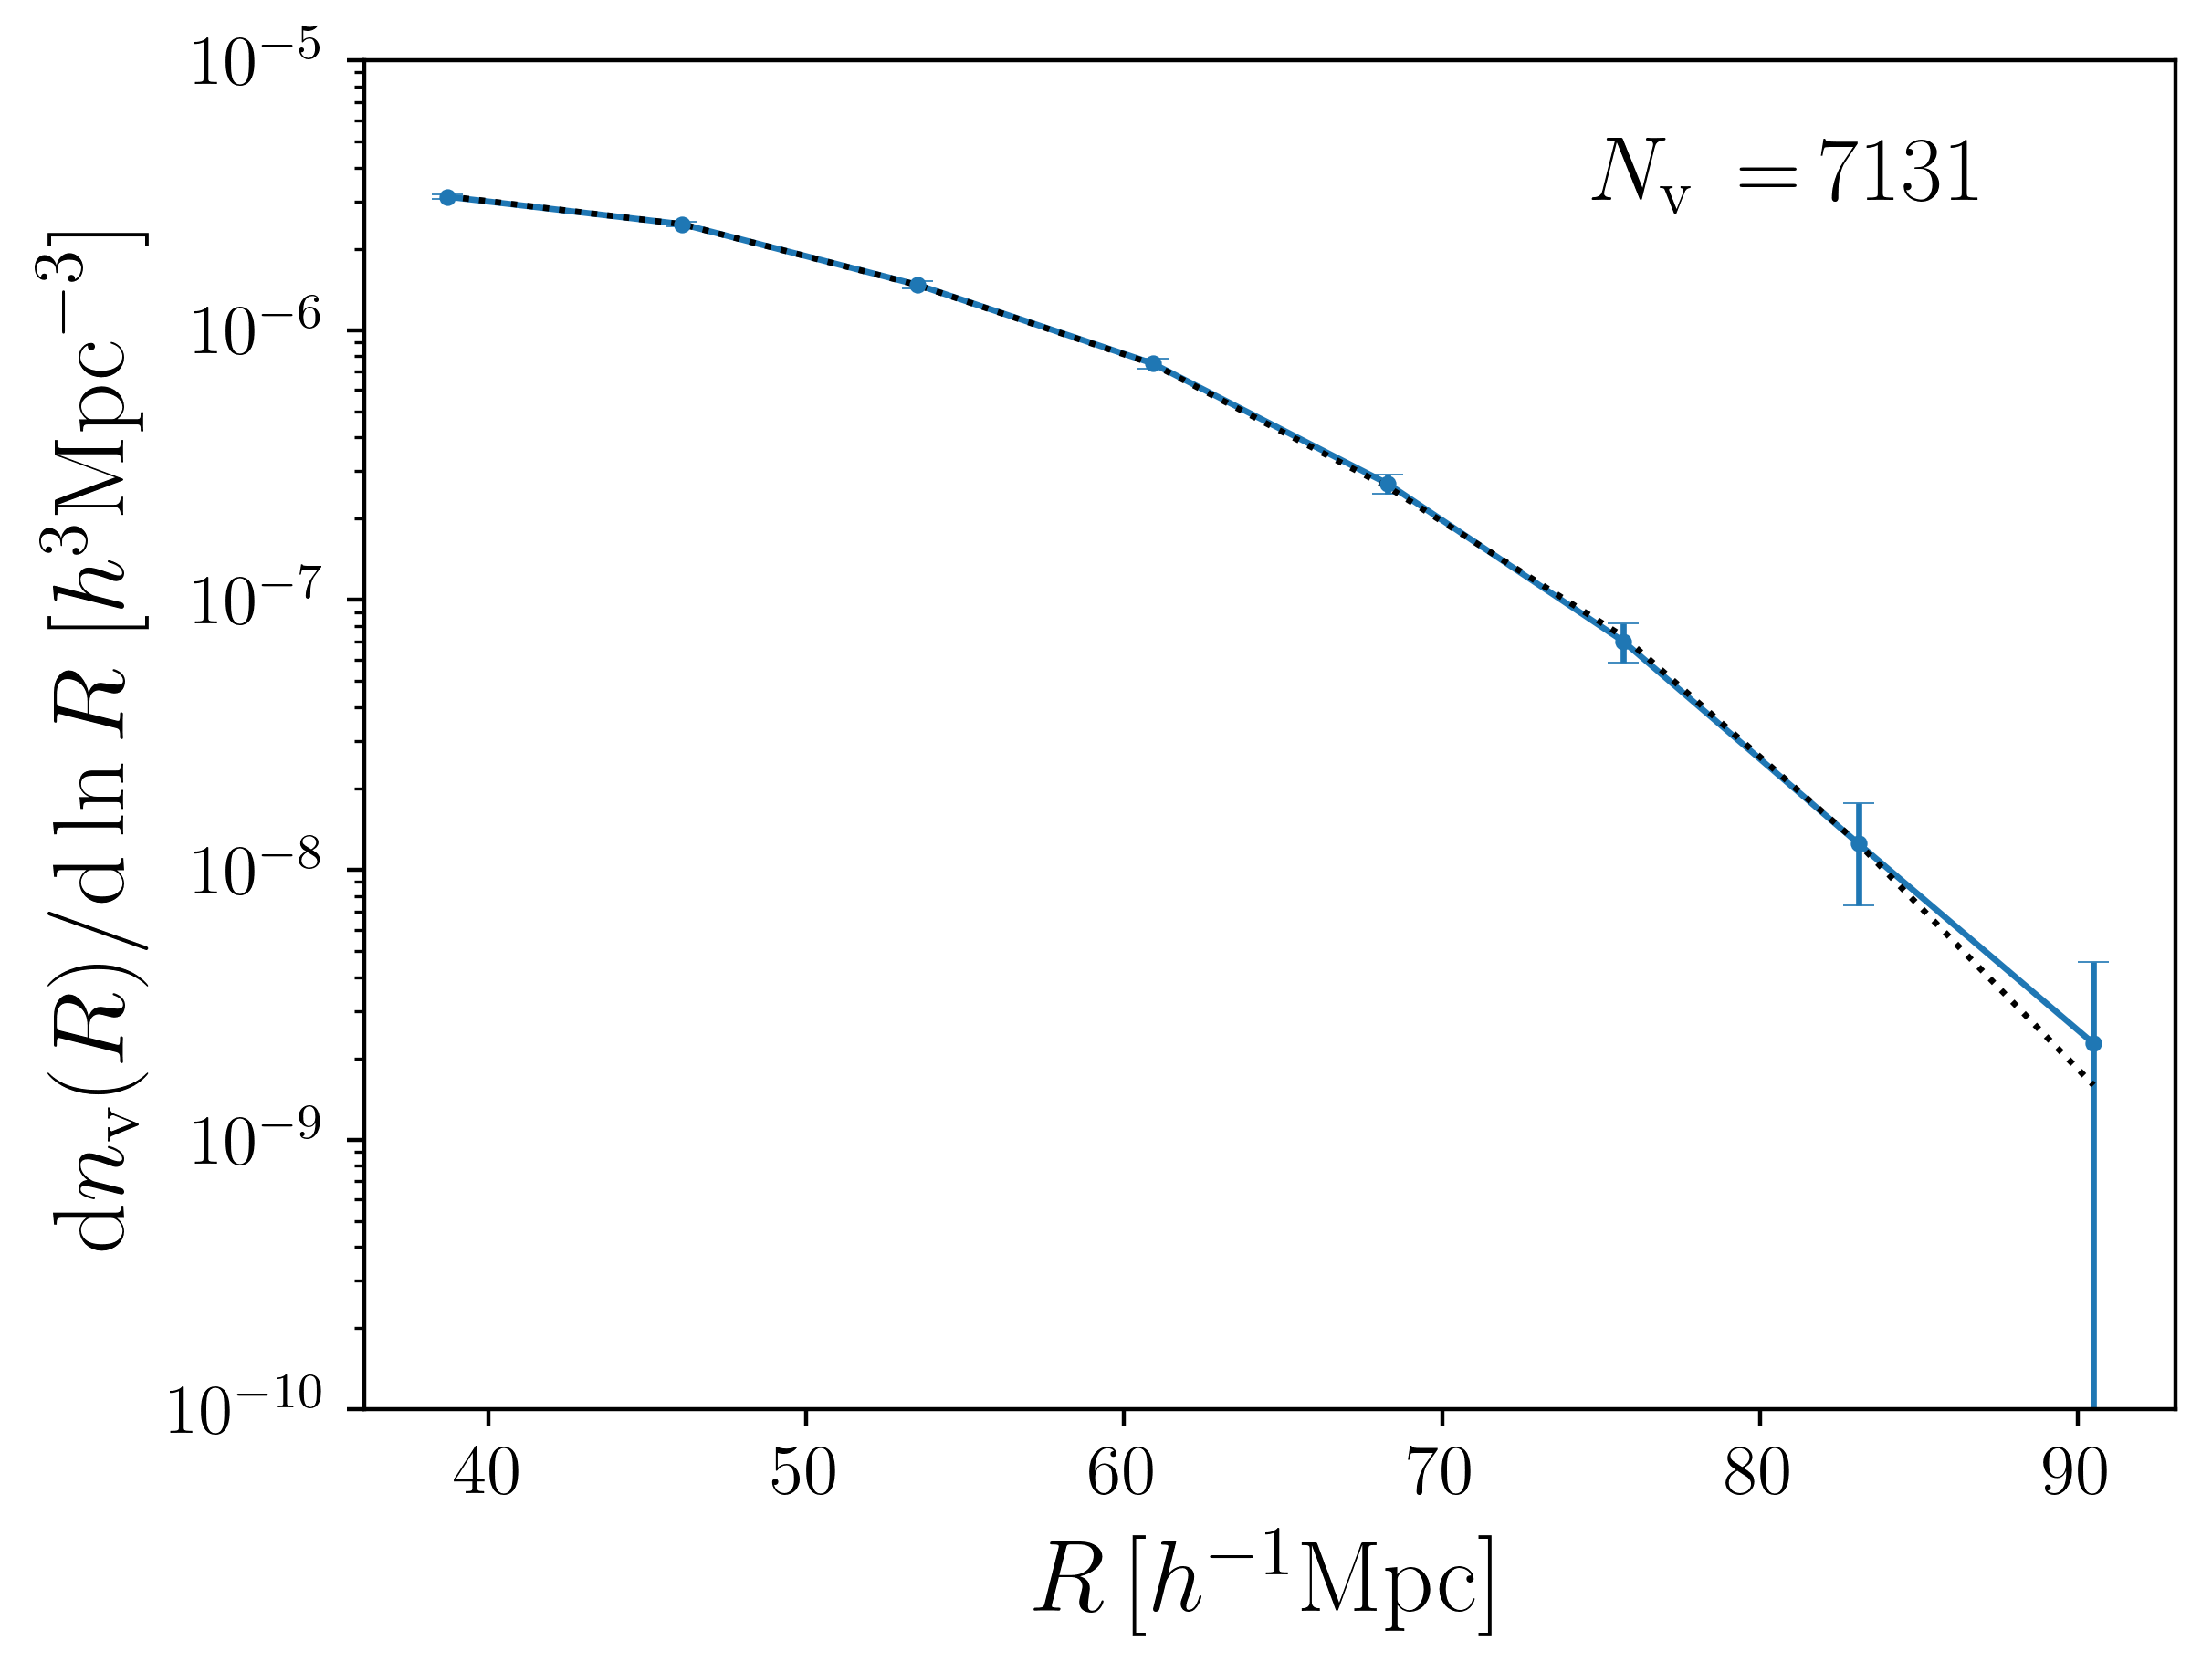
Distribution of void effective-radius (void size function) and corresponding randoms (dotted).
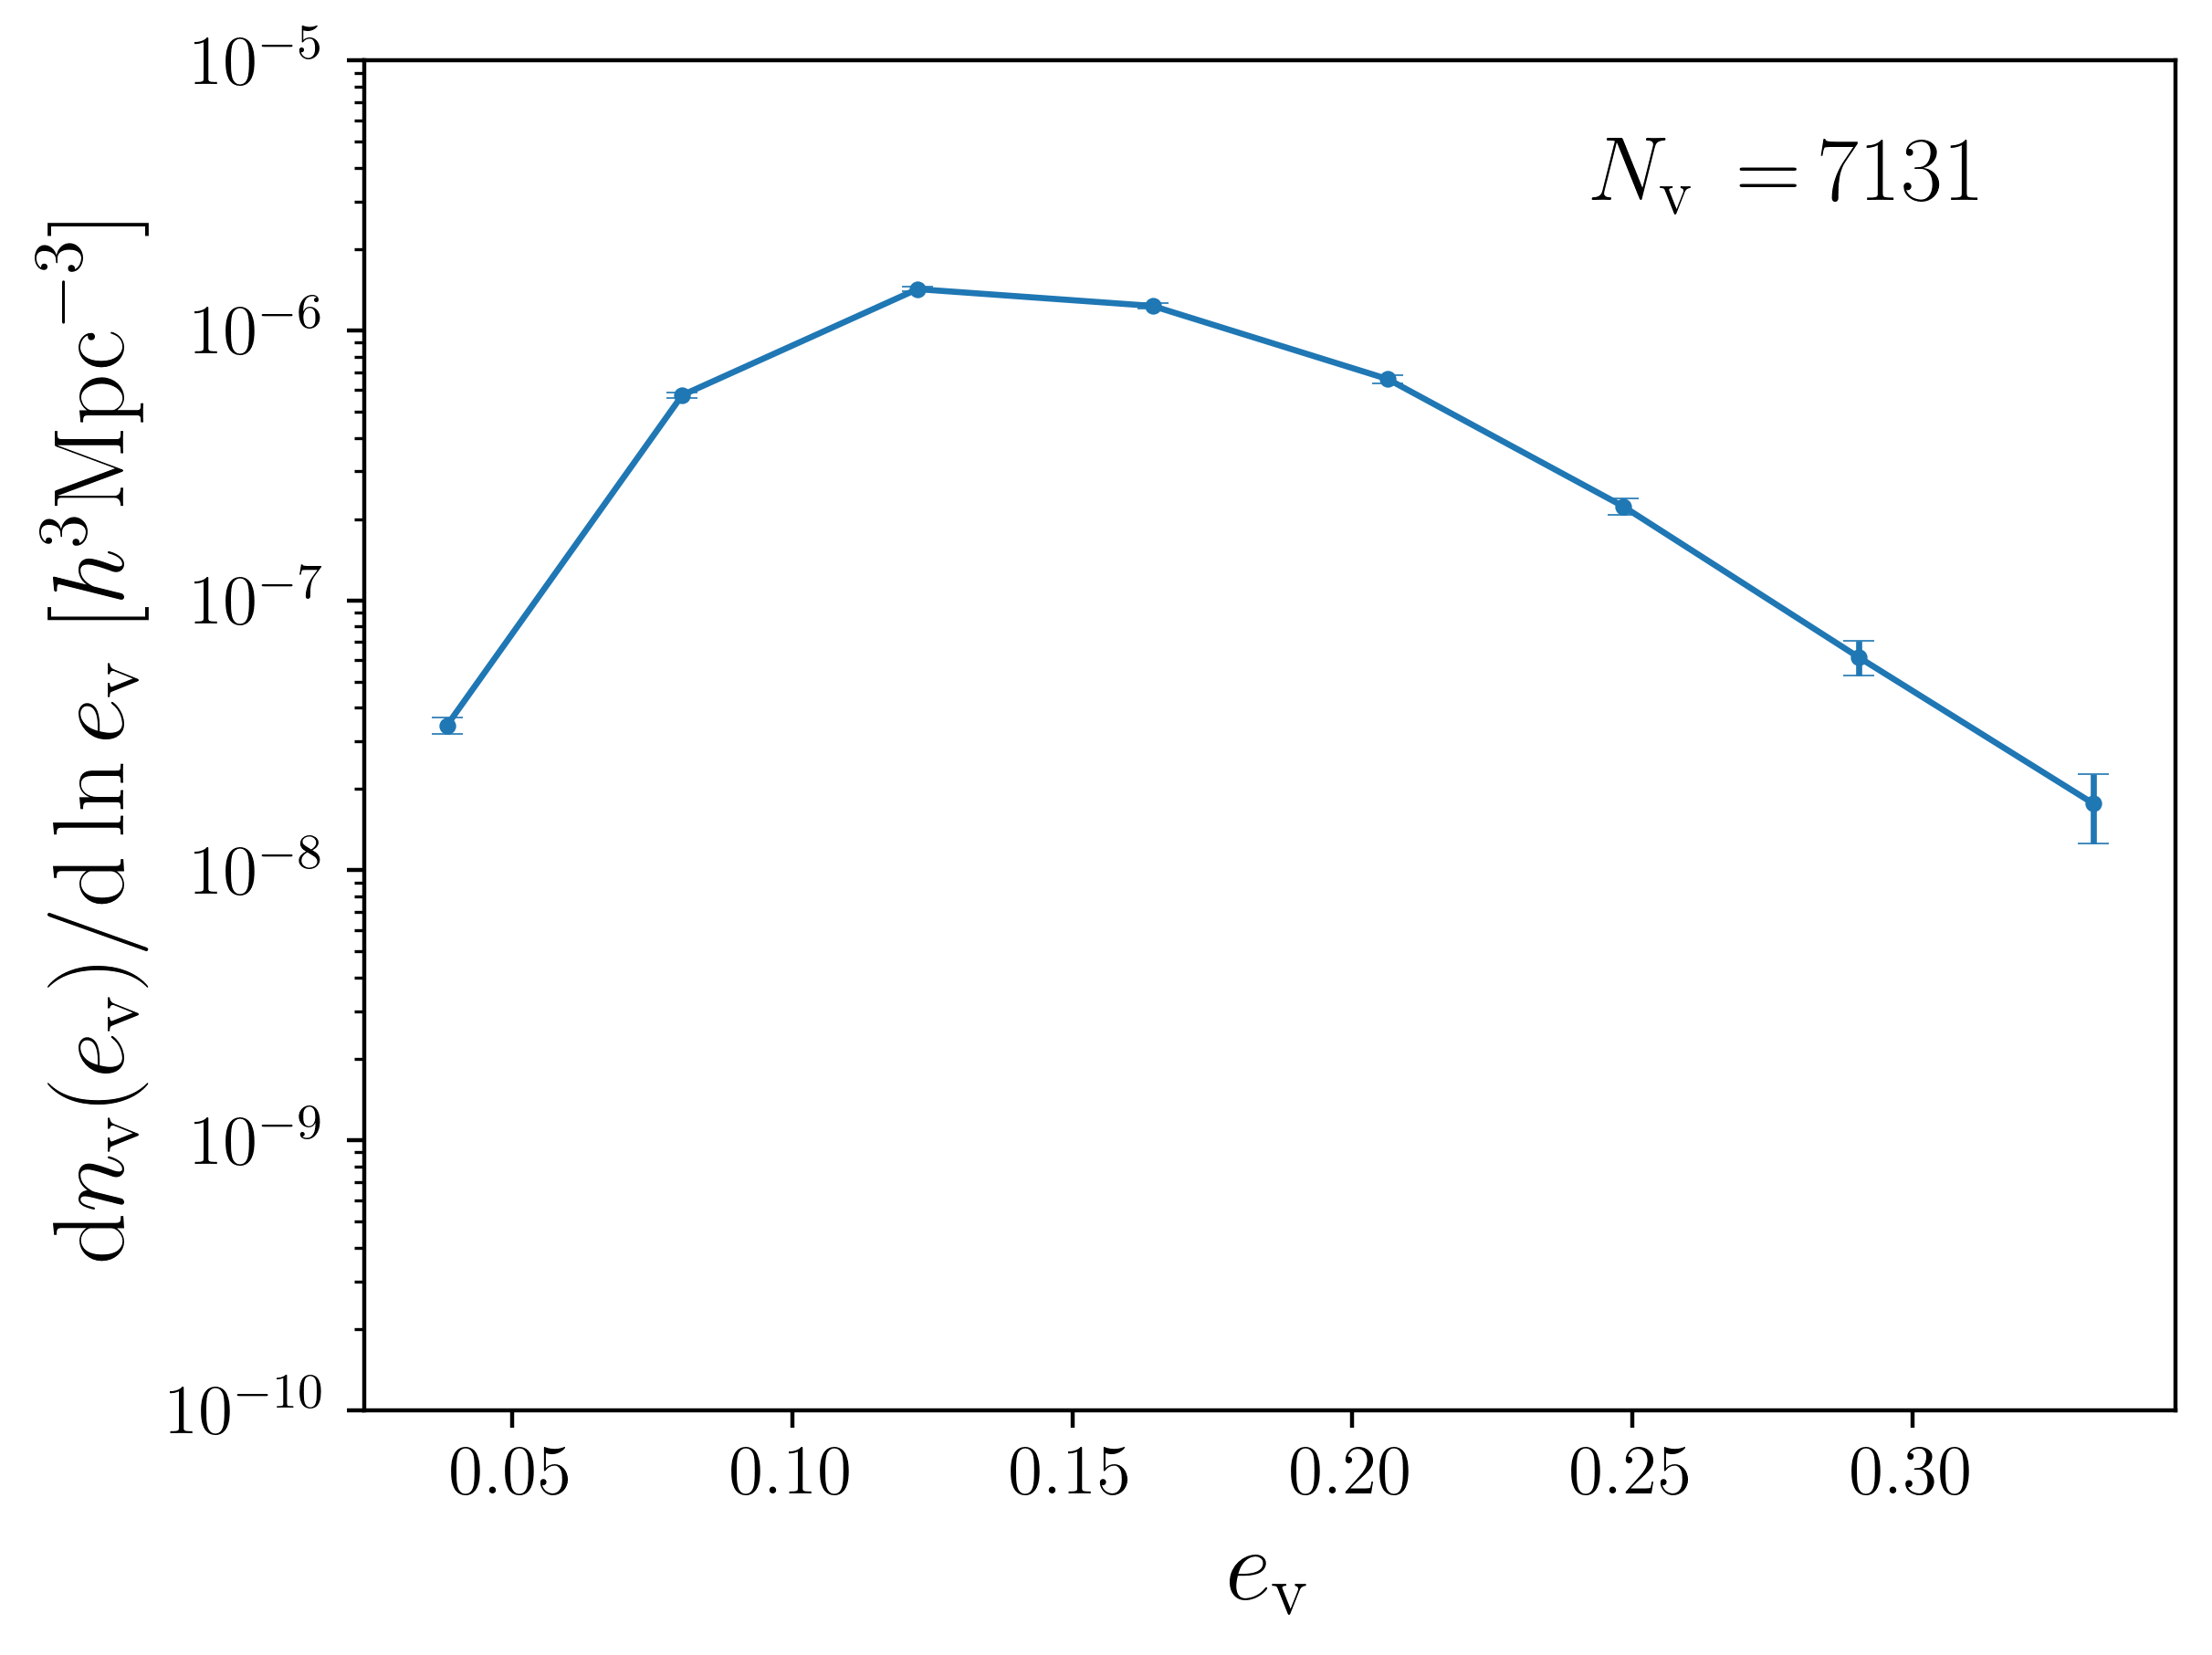
Distribution of void ellipticity (void shape function).
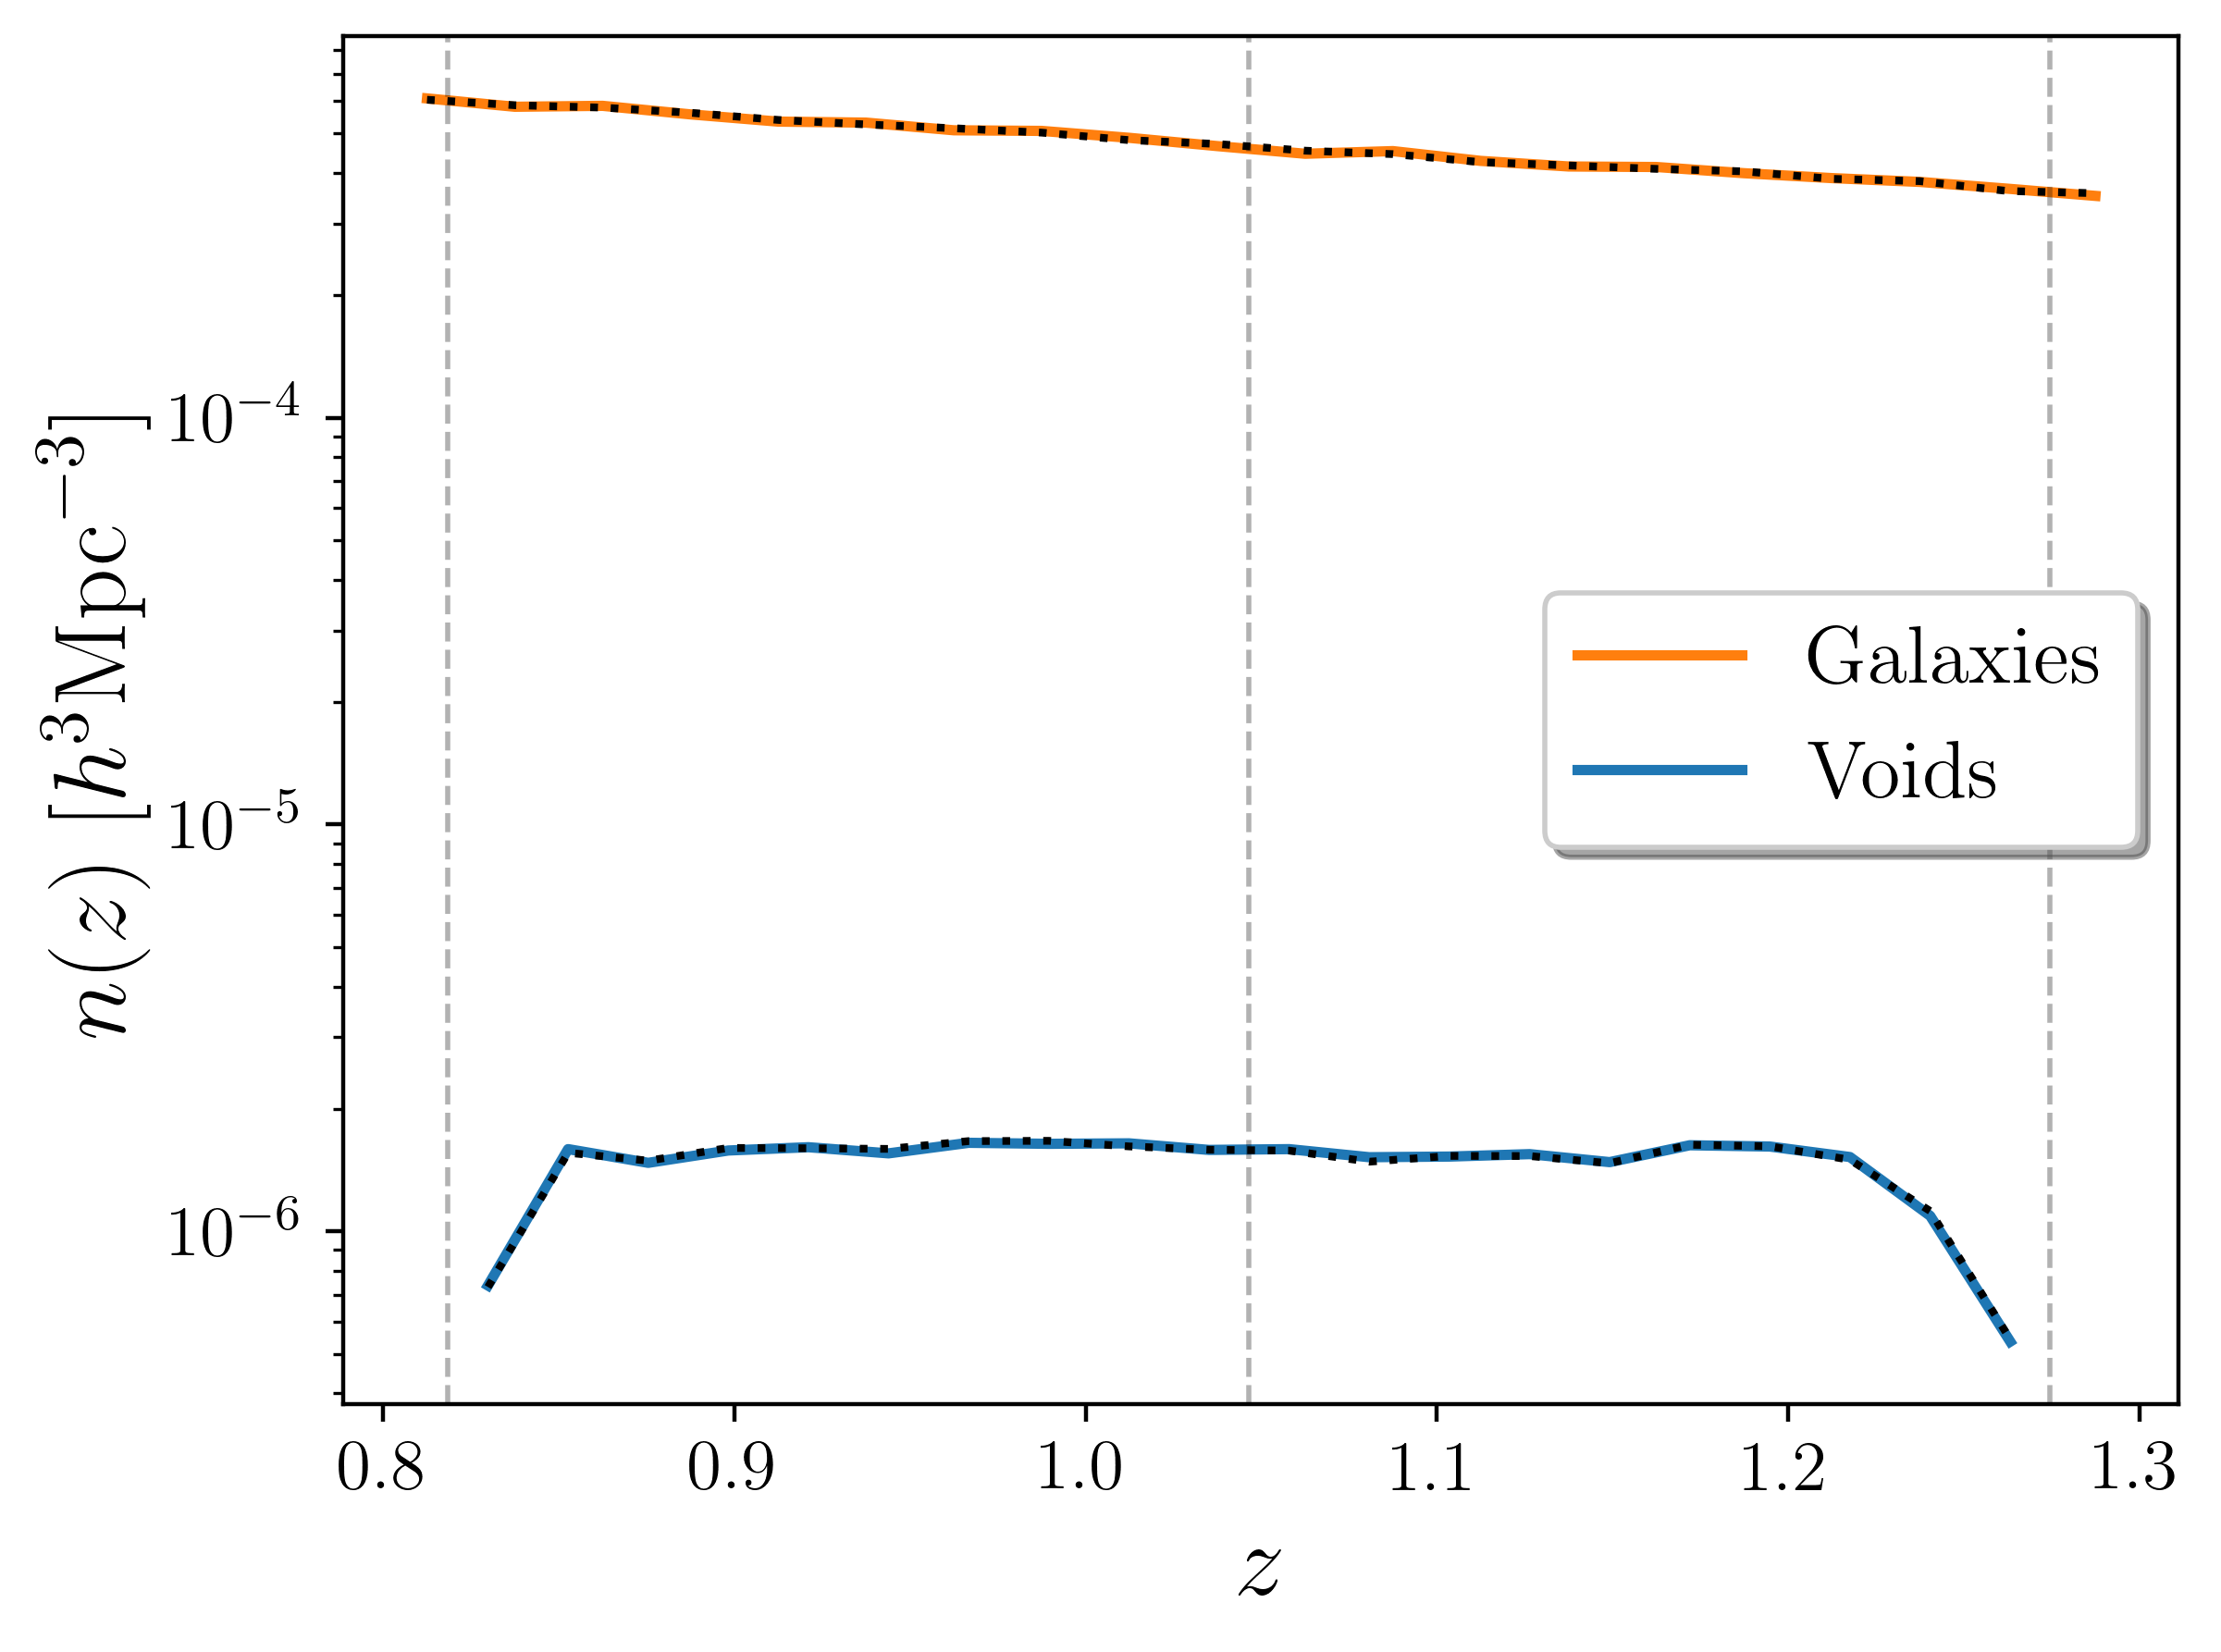
Distribution of void (and galaxy) redshift (selection function) and corresponding randoms (dotted).
Correlation functions
Spatial correlations between void centers and tracers (galaxies) are provided in three variants: projected correlations on the sky named xi_p, multipoles of the 3D correlation function named xi_ell, and plane-of-sky vs. line-of-sight 2D correlation functions named xi_2d. In addition, the file xi_ell= provides only one specified multipole order, appended as an integer in the name. Finally, the file xi_p_test features a test for the projected and deprojected correlation function from a best-fit HSW profile as a template for the real data. All of these file names are appended by an additional integer that specifies the particular bin of the data (e.g., redshift or effective radius).
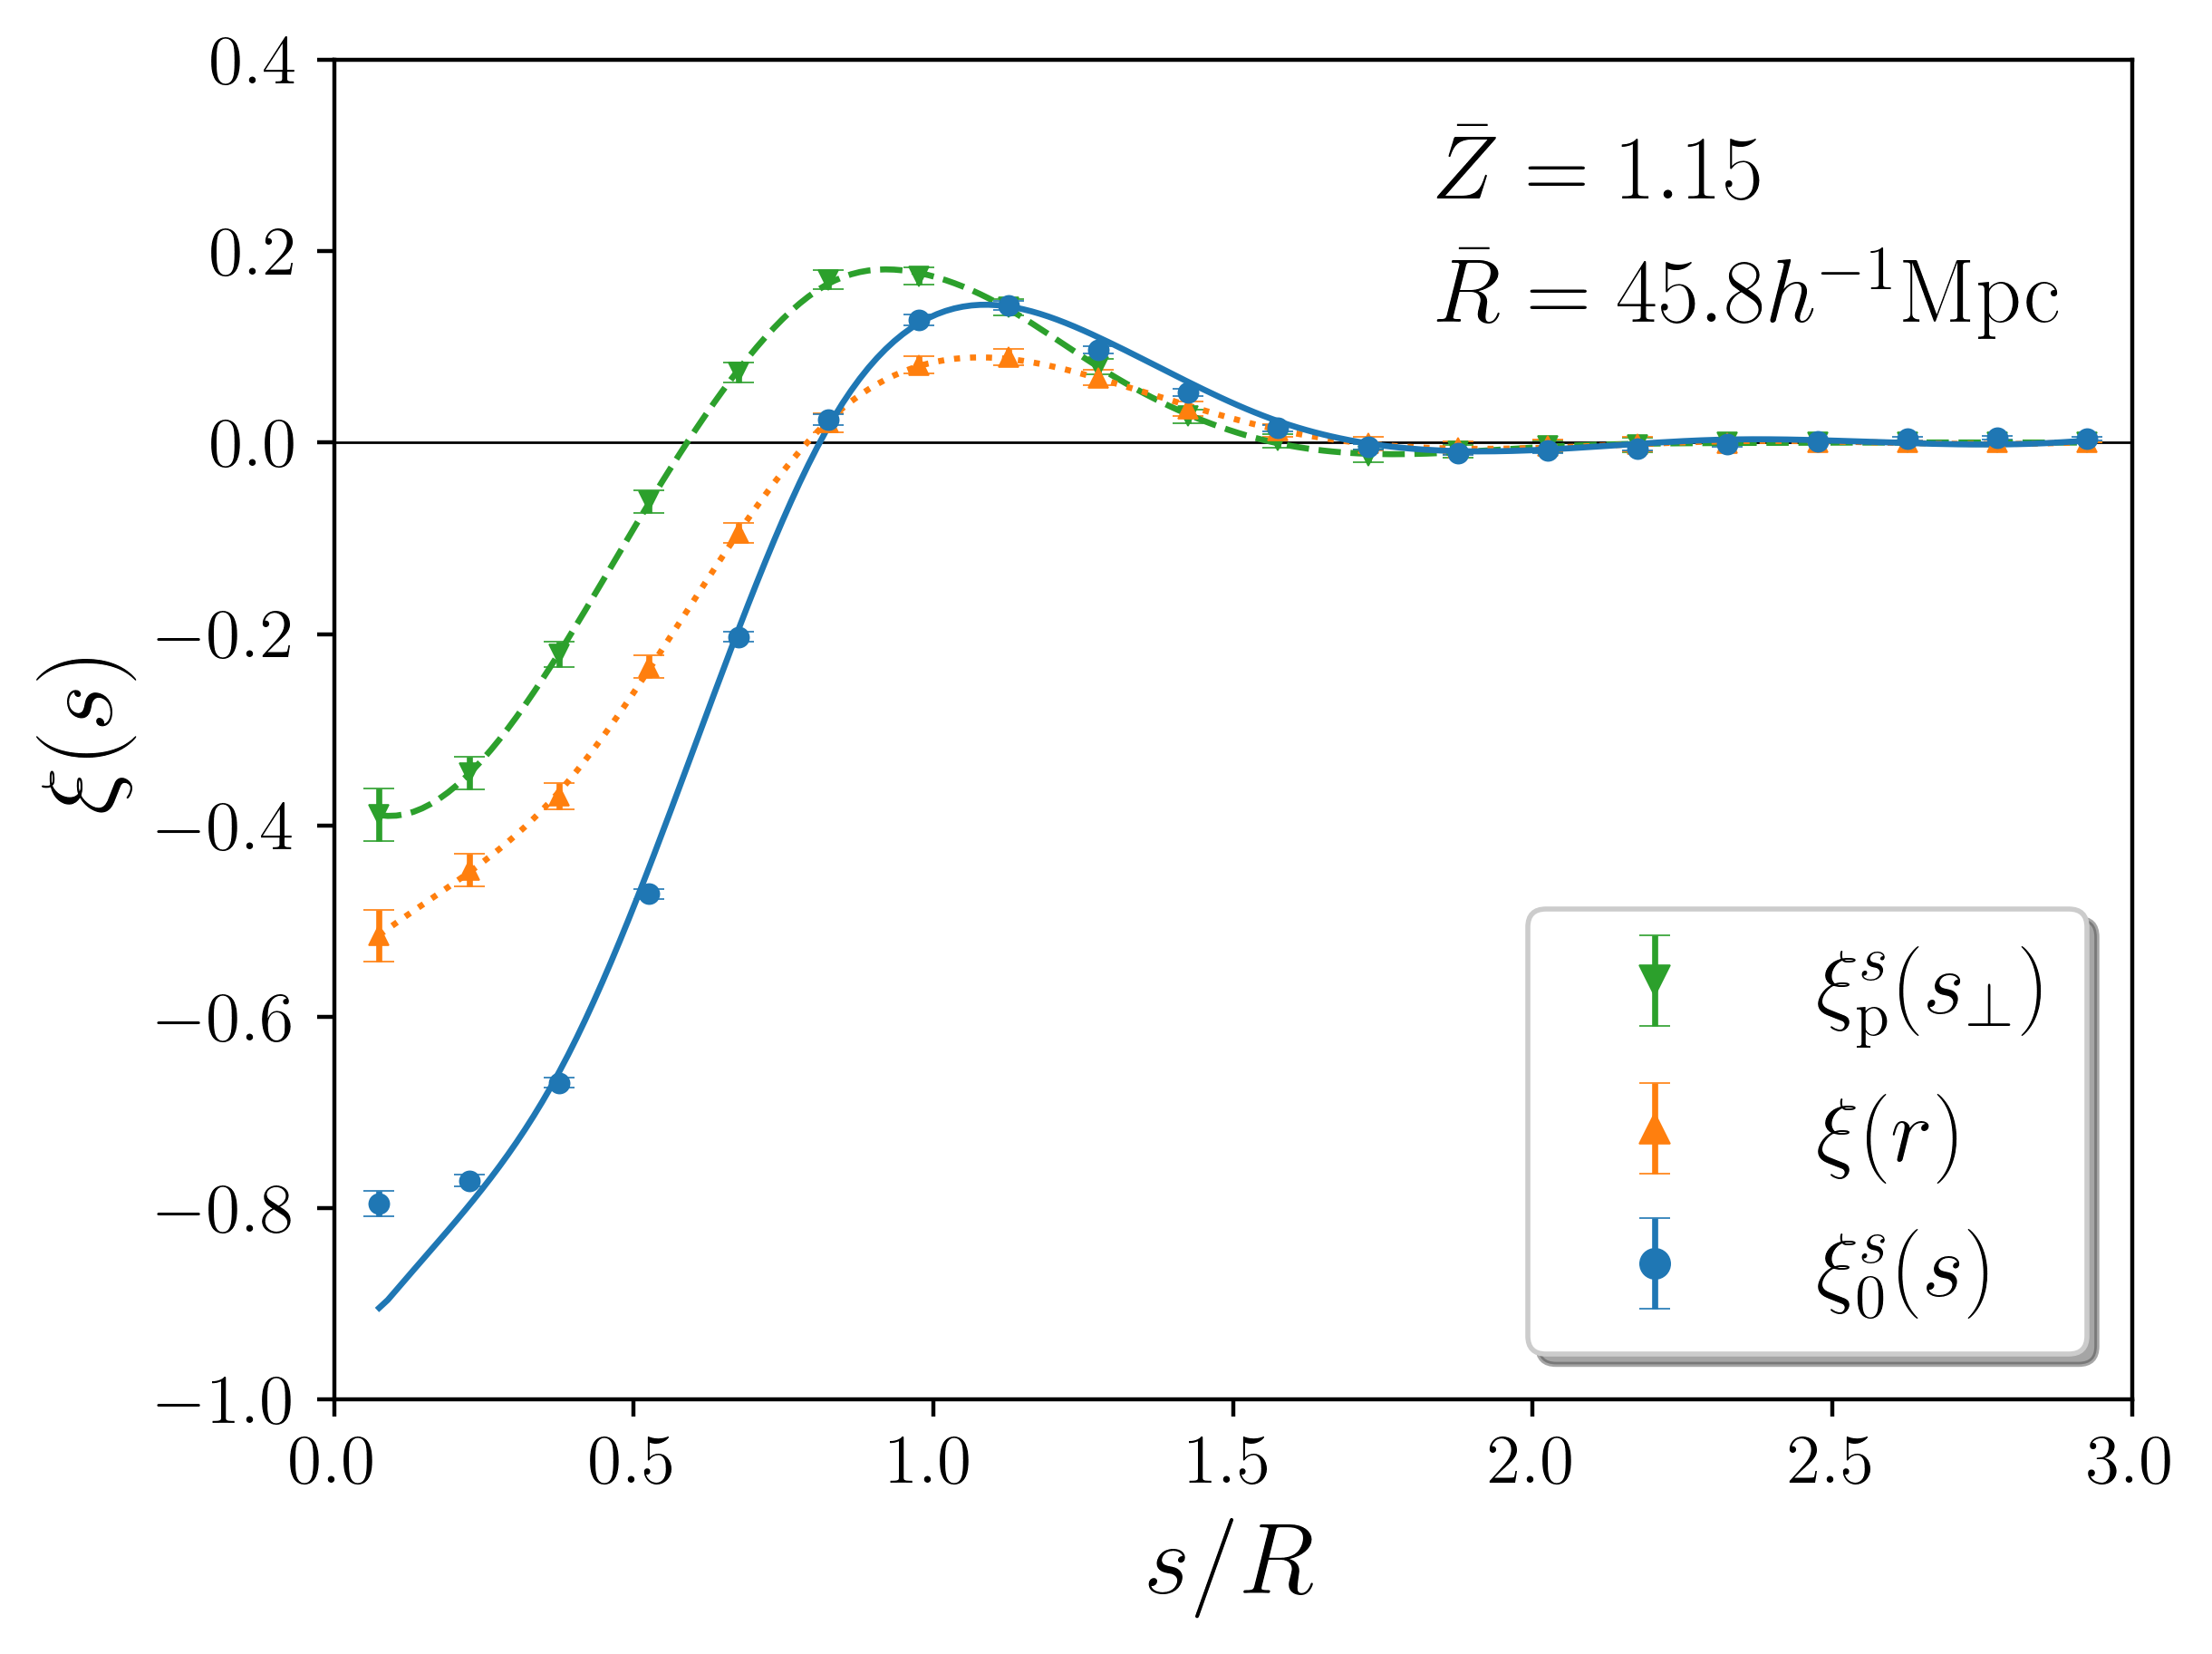
xi_p: projected void-galaxy correlation function (downward triangles with model as dashed line), its deprojection (upward triangles with model as dotted line), and monopole in redshift space (circles with model as solid line).
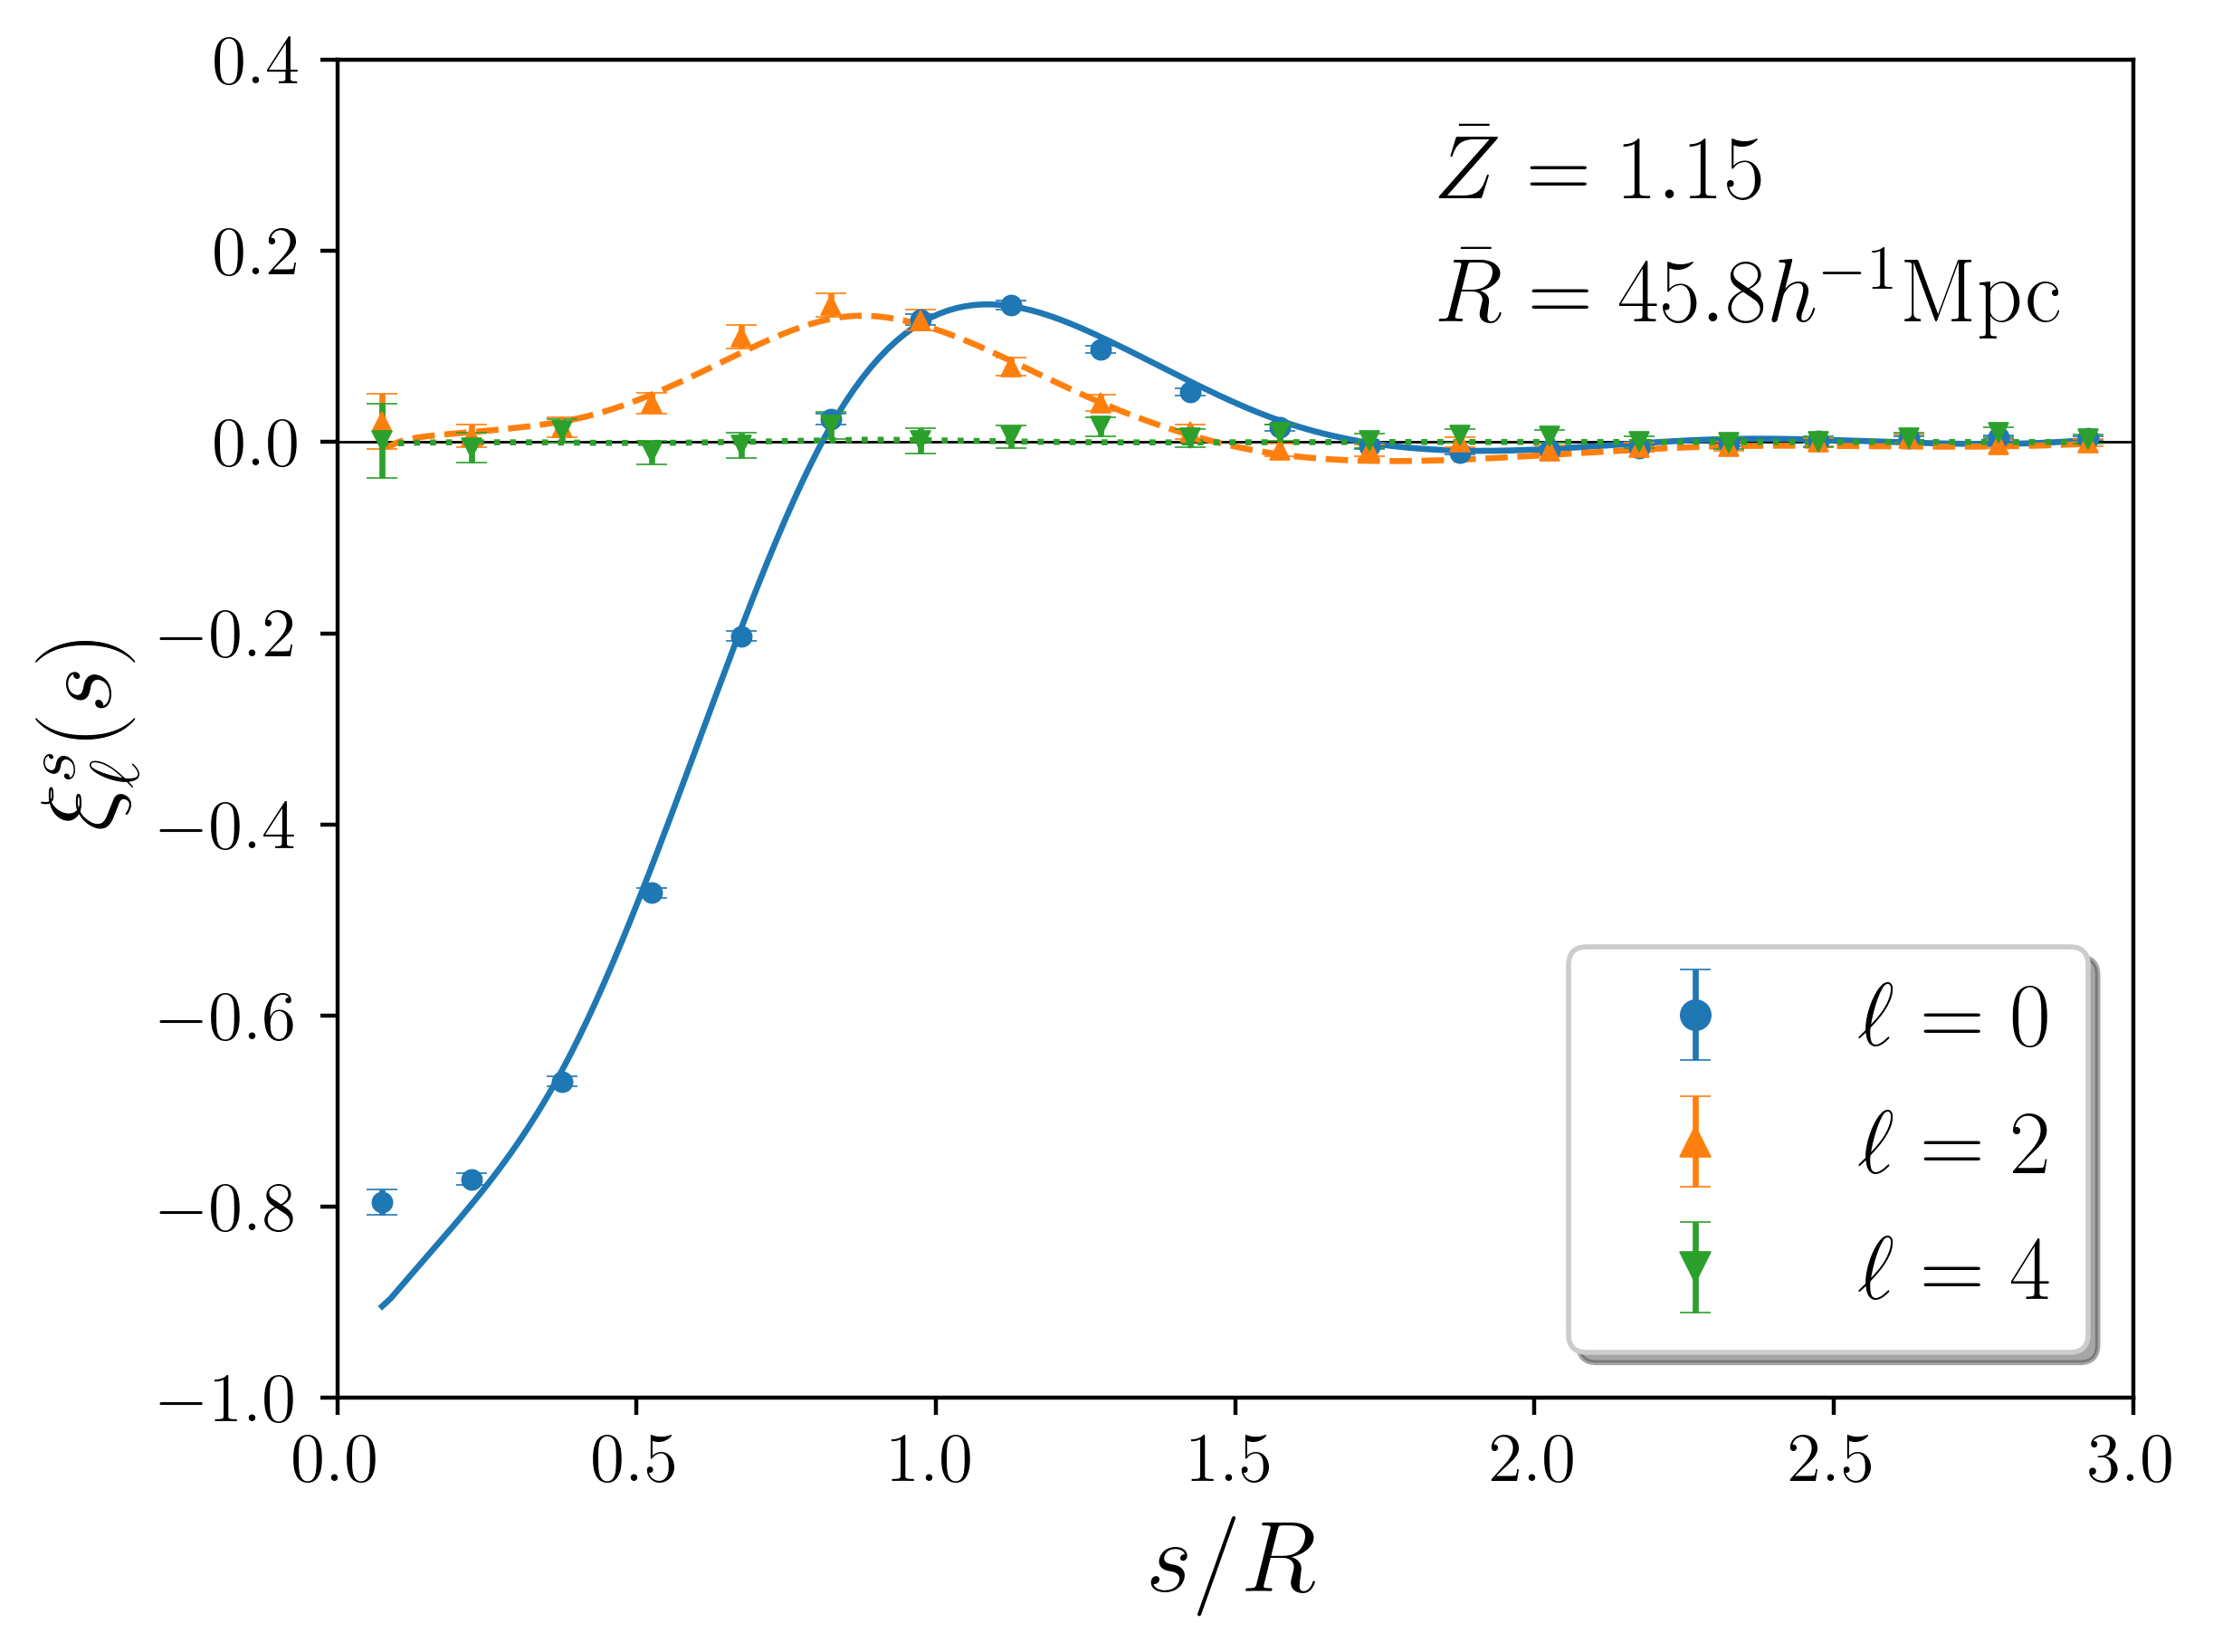
xi_ell: monopole (circles with model as solid line), quadrupole (upward triangles with model as dashed line), and hexadecapole (downward triangles with model as dotted line) of void-galaxy correlation function.
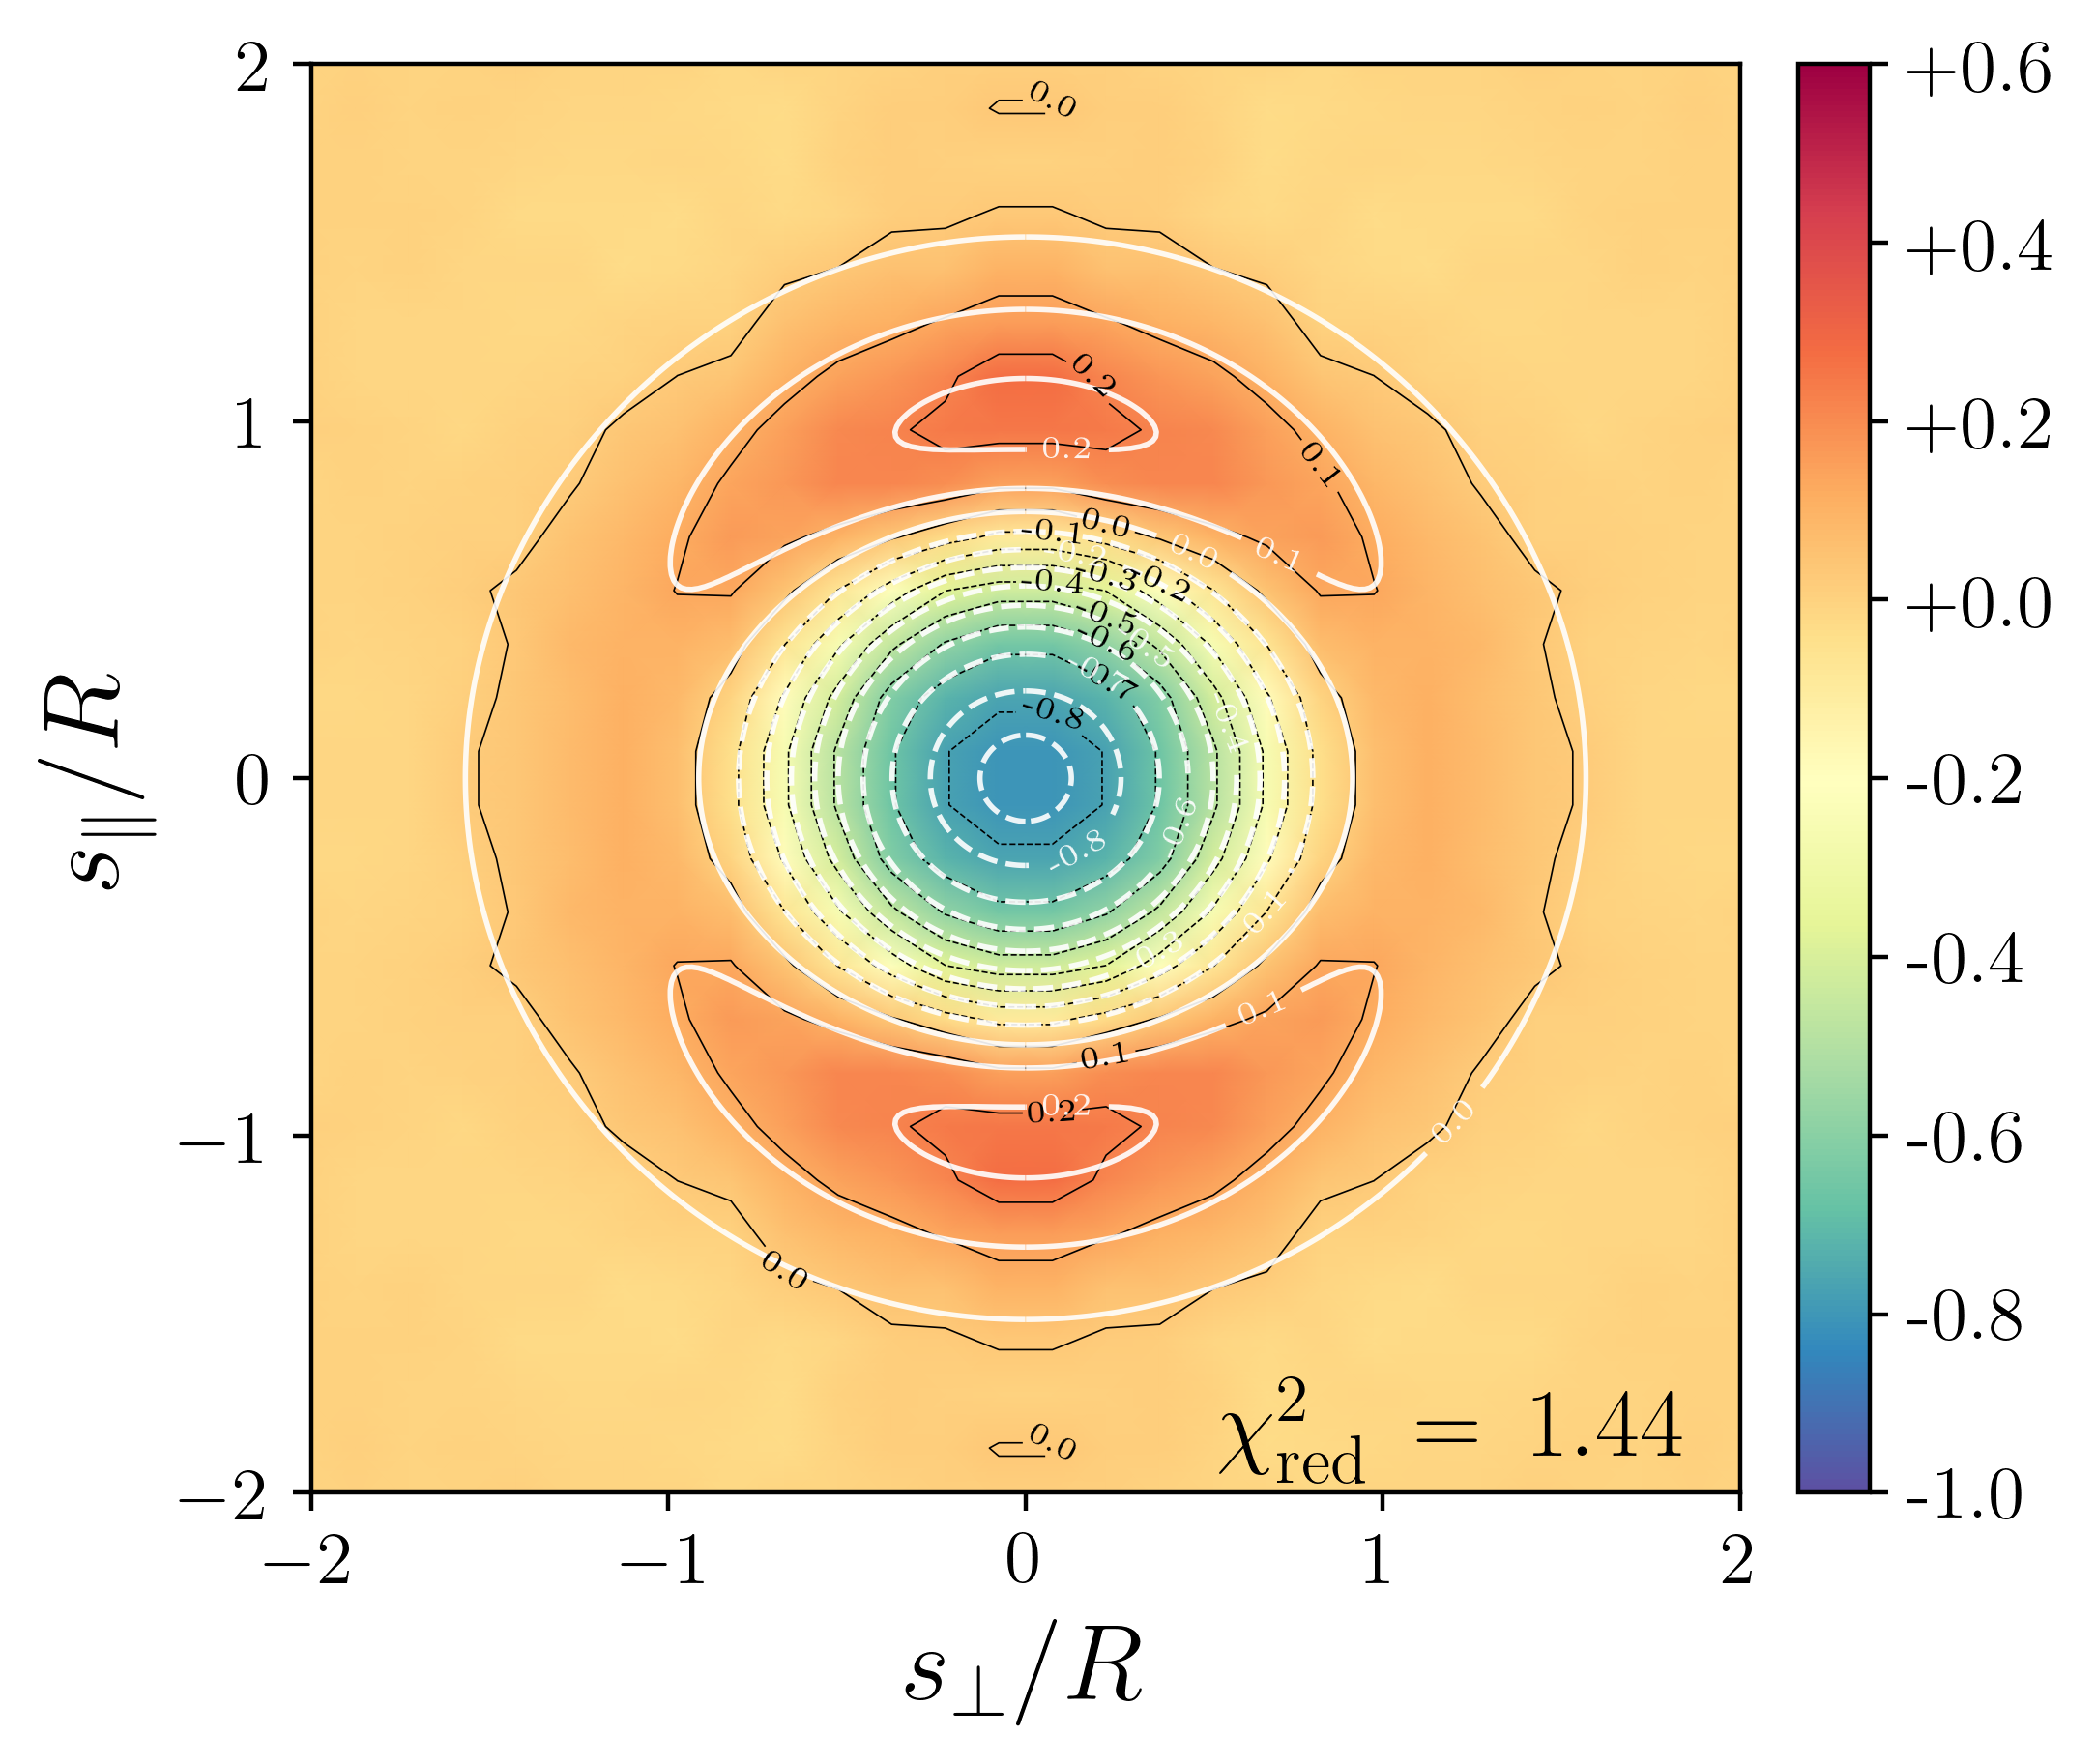
xi_2d: 2D void-galaxy cross-correlation function along and perpendicular to the line of sight (black contours with color scale) with best-fit model (white contour lines).
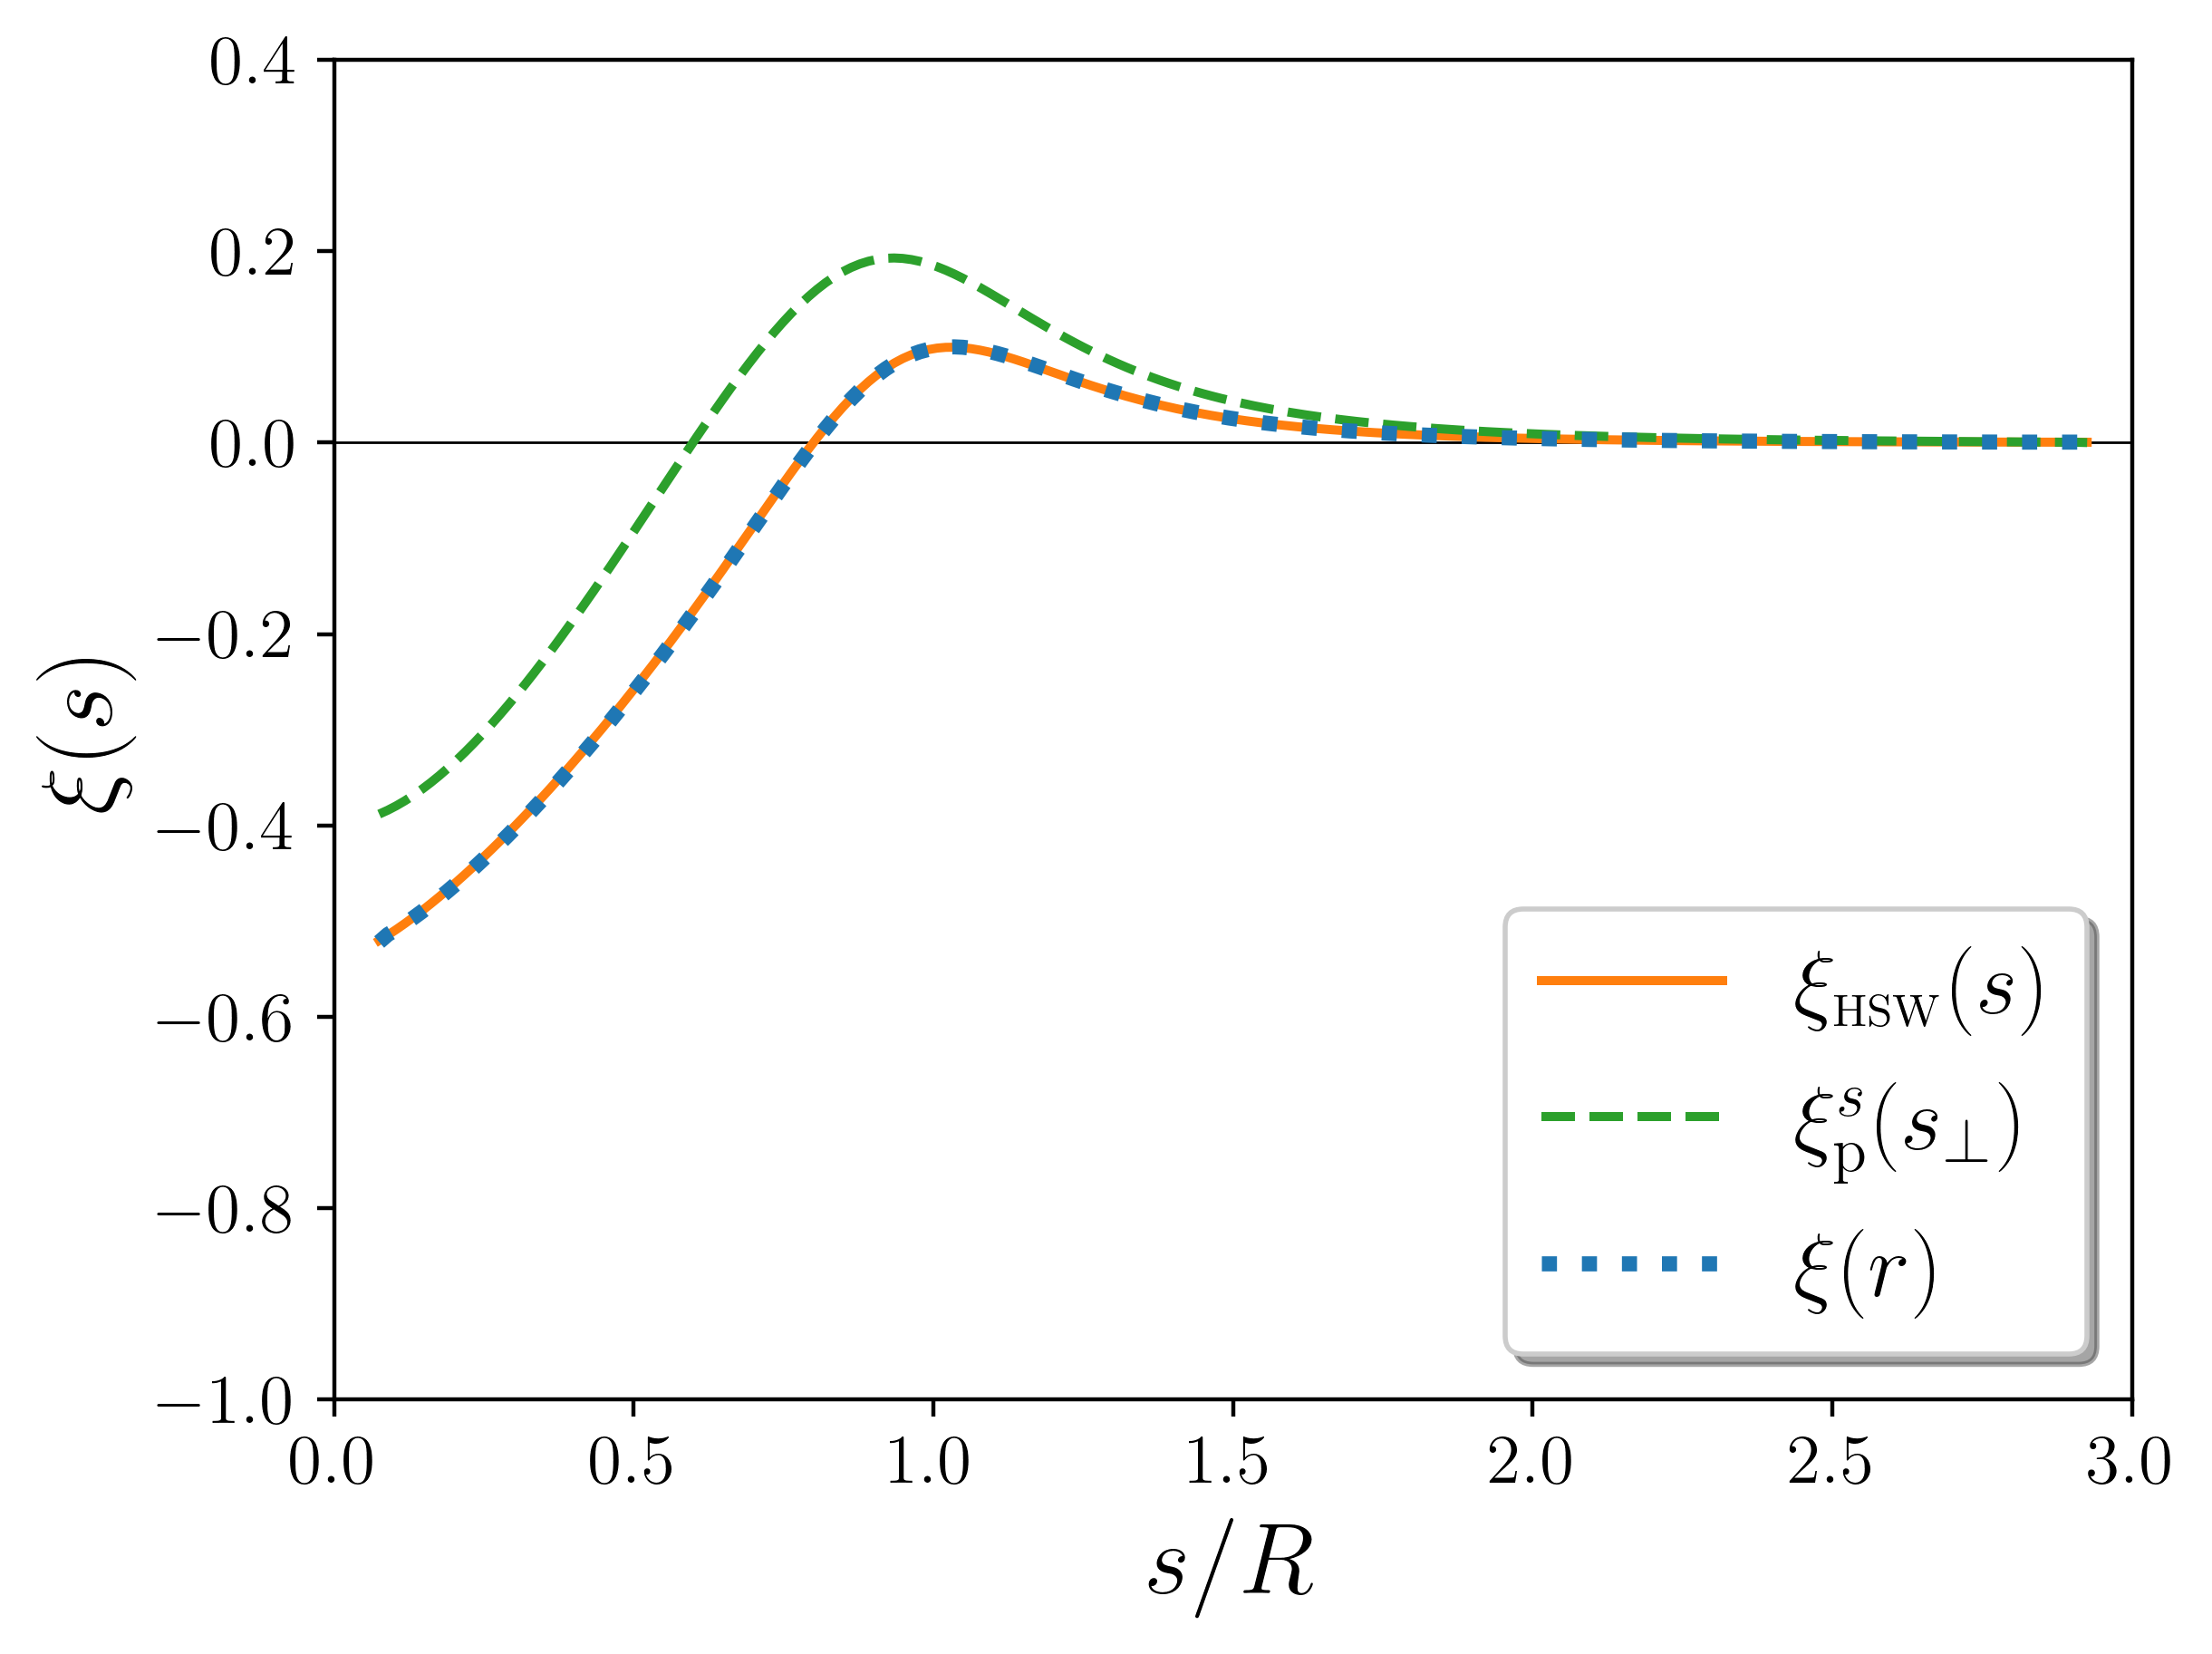
xi_p_test: best-fit HSW profile to deprojected void-galaxy correlation function (solid line), its projection on the sky (dashed line), and subsequent deprojection based on the inverse Abel transform (dotted line).
Covariance
Covariance matrices for the void-galaxy correlation function are available, both for its multipoles, as well as for its 2D version with directions along and perpendicular to the line of sight.
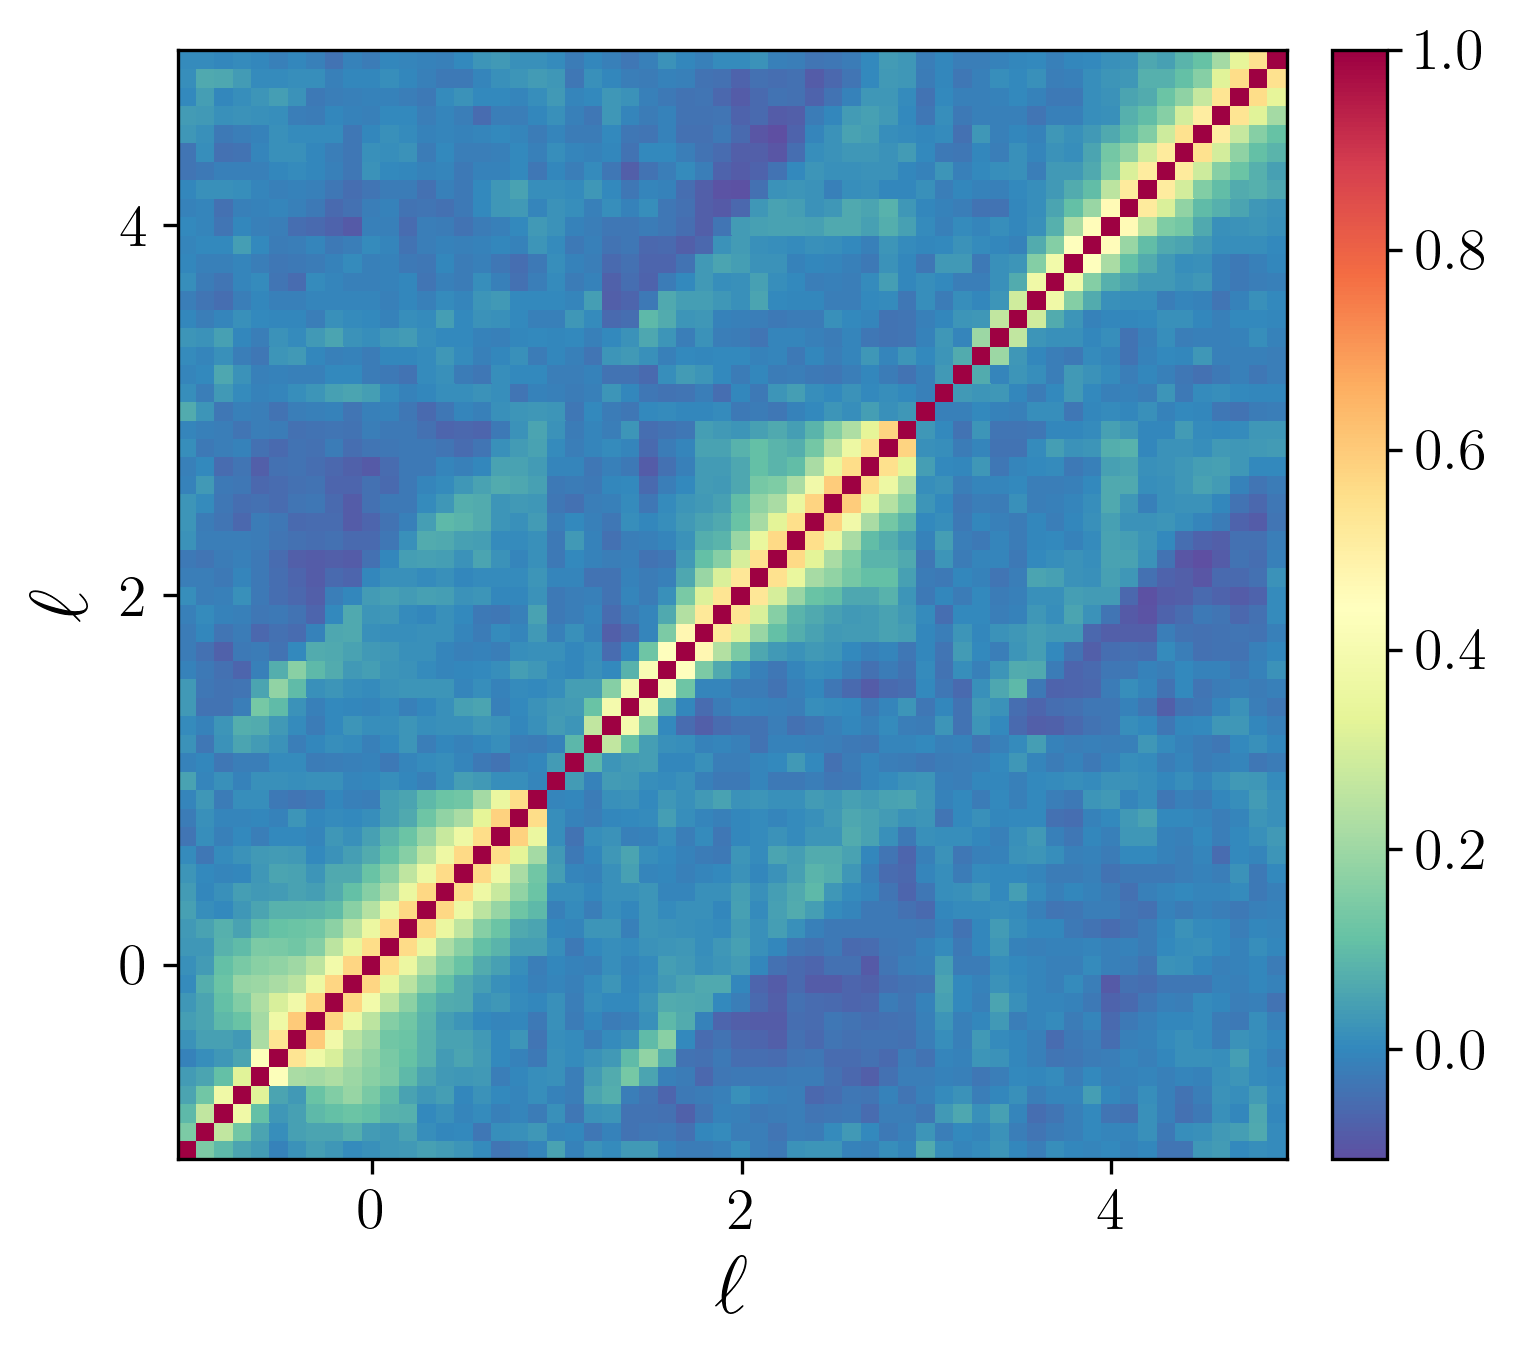
cov_ell: covariance matrix for multipoles of the void-galaxy correlation function, normalized by its diagonal.
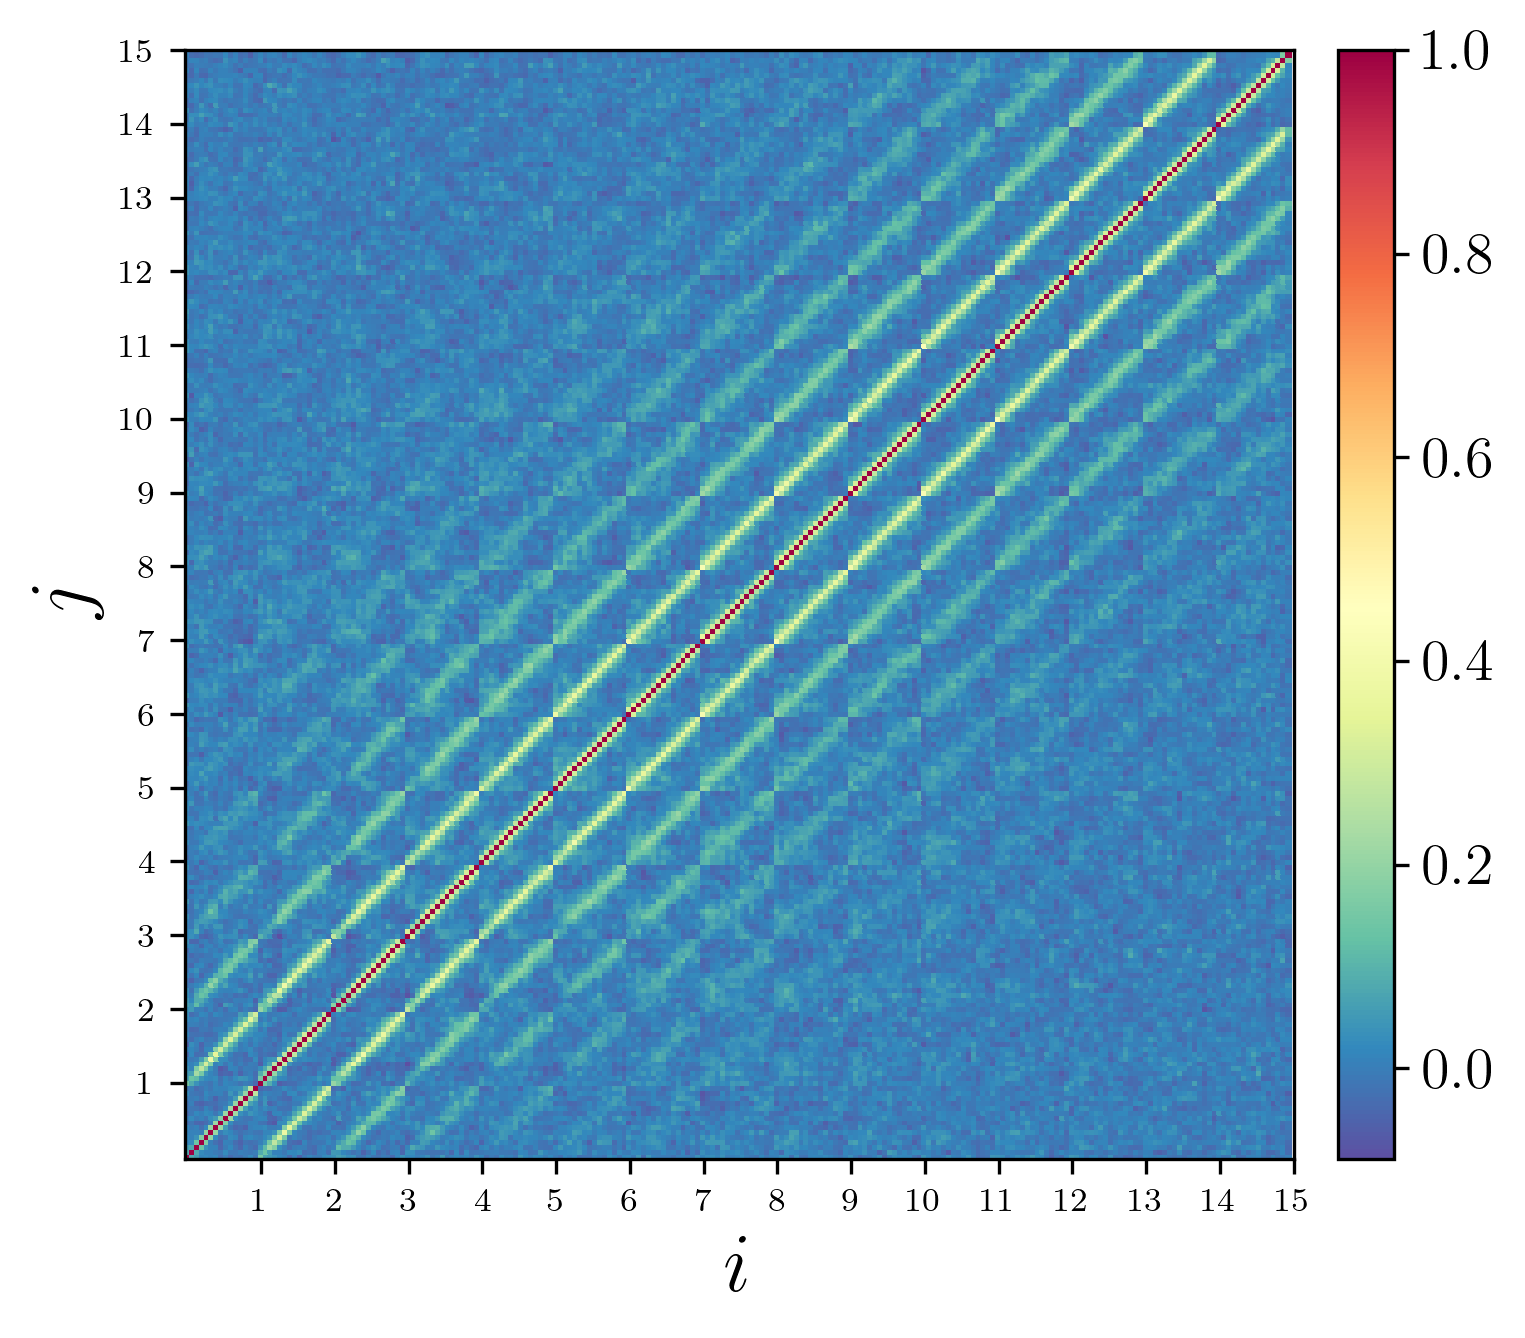
cov_2d: covariance matrix for the 2D void-galaxy correlation function, normalized by its diagonal.
Parameter inference
The likelihood analysis of the void-galaxy correlation function provides constraints on dynamic and geometric distortions, which can be paramerized via the ratio of growth rate and bias \(f/b\), and the Alcock-Paczynski parameter ratio \(q_\perp/q_\parallel\), respectively. The files named triangle contain a corner plot of the posterior probability distribution (including nuisance parameters \(\mathcal{M}\) and \(\mathcal{Q}\)) for each bin of the data vector. These parameters are proportional to the product of growth rate and rms fluctuation amplitude \(f\sigma_8\), as well as the product of comoving angular diameter distance and Hubble rate \(D_\mathrm{A}H\), which are shown in the file fs8_DAH. In turn, measurements of \(D_\mathrm{A}H\) probe the expansion history of the Universe and can be used to infer some fundamental cosmological parameters. The files named triangle, appended by the particular assumed model (e.g., LCDM, wCDM, or w0waCDM) contain the posterior distribution of the constrained cosmological parameters of the specified model.
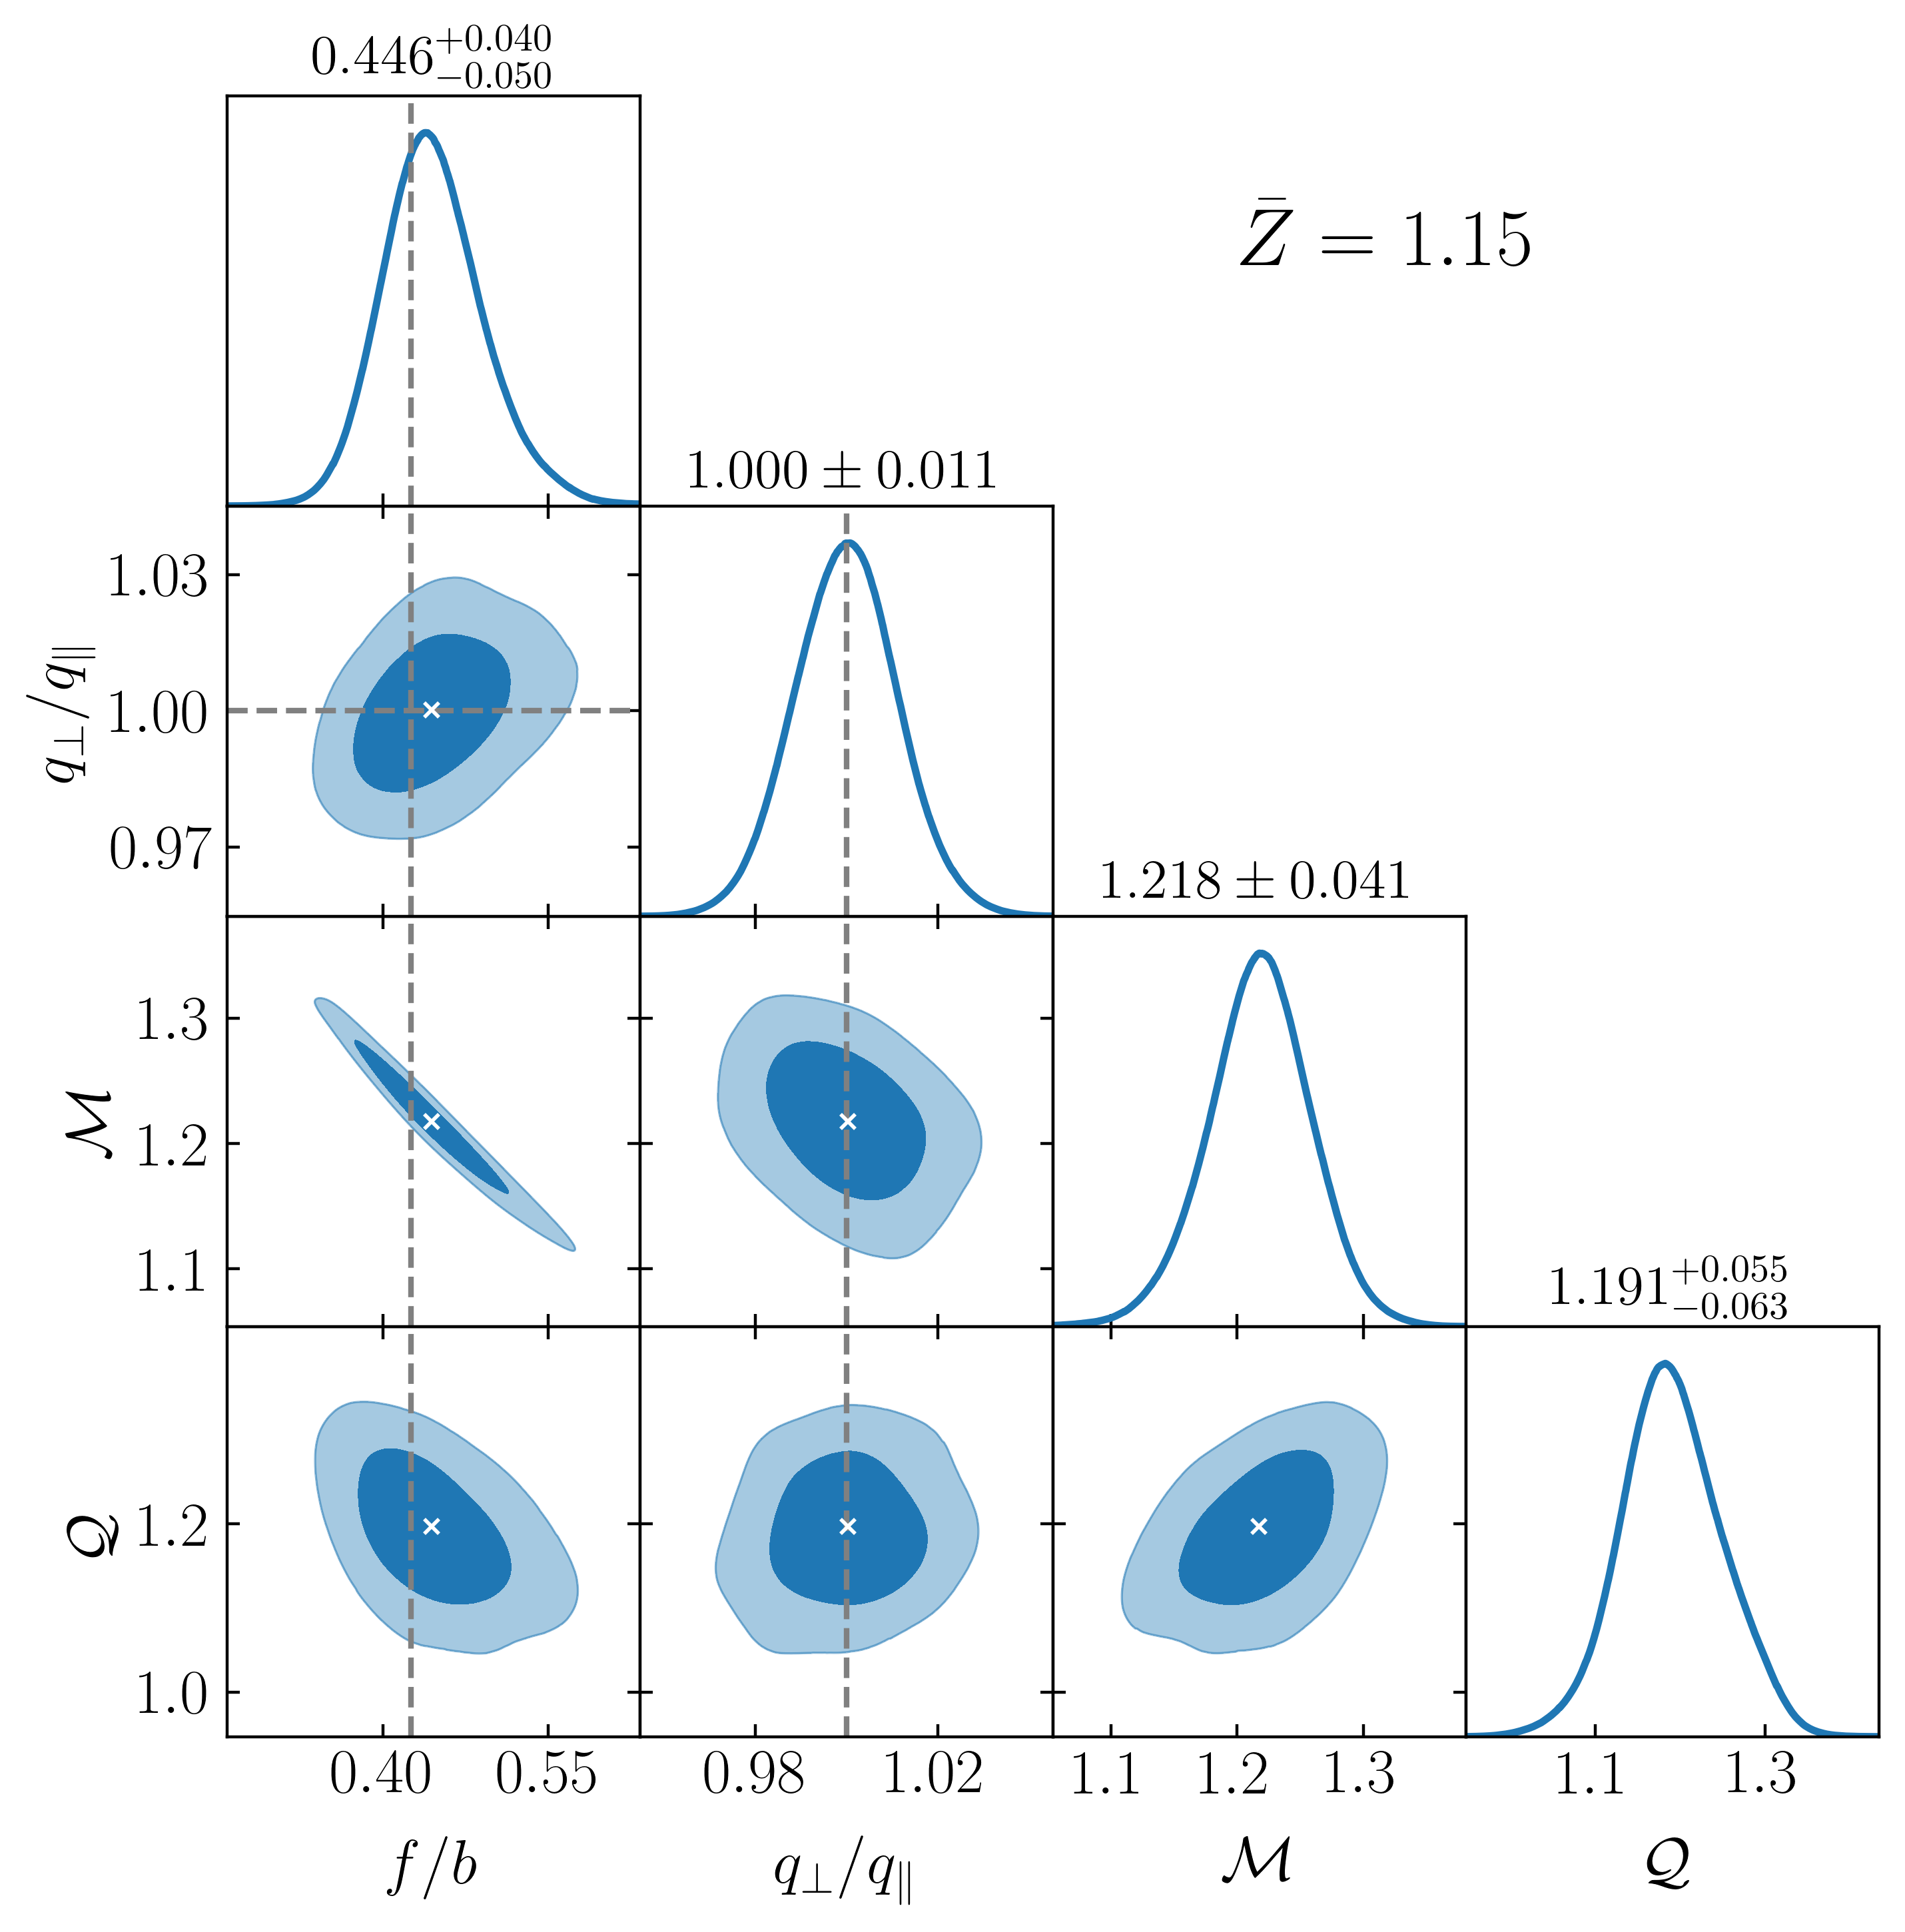
triangle: corner plot of posterior distribution for model and nuisance parameters with its maximum (white cross). Shown are 68% and 95% confidence regions and the fiducial model as dashed lines.
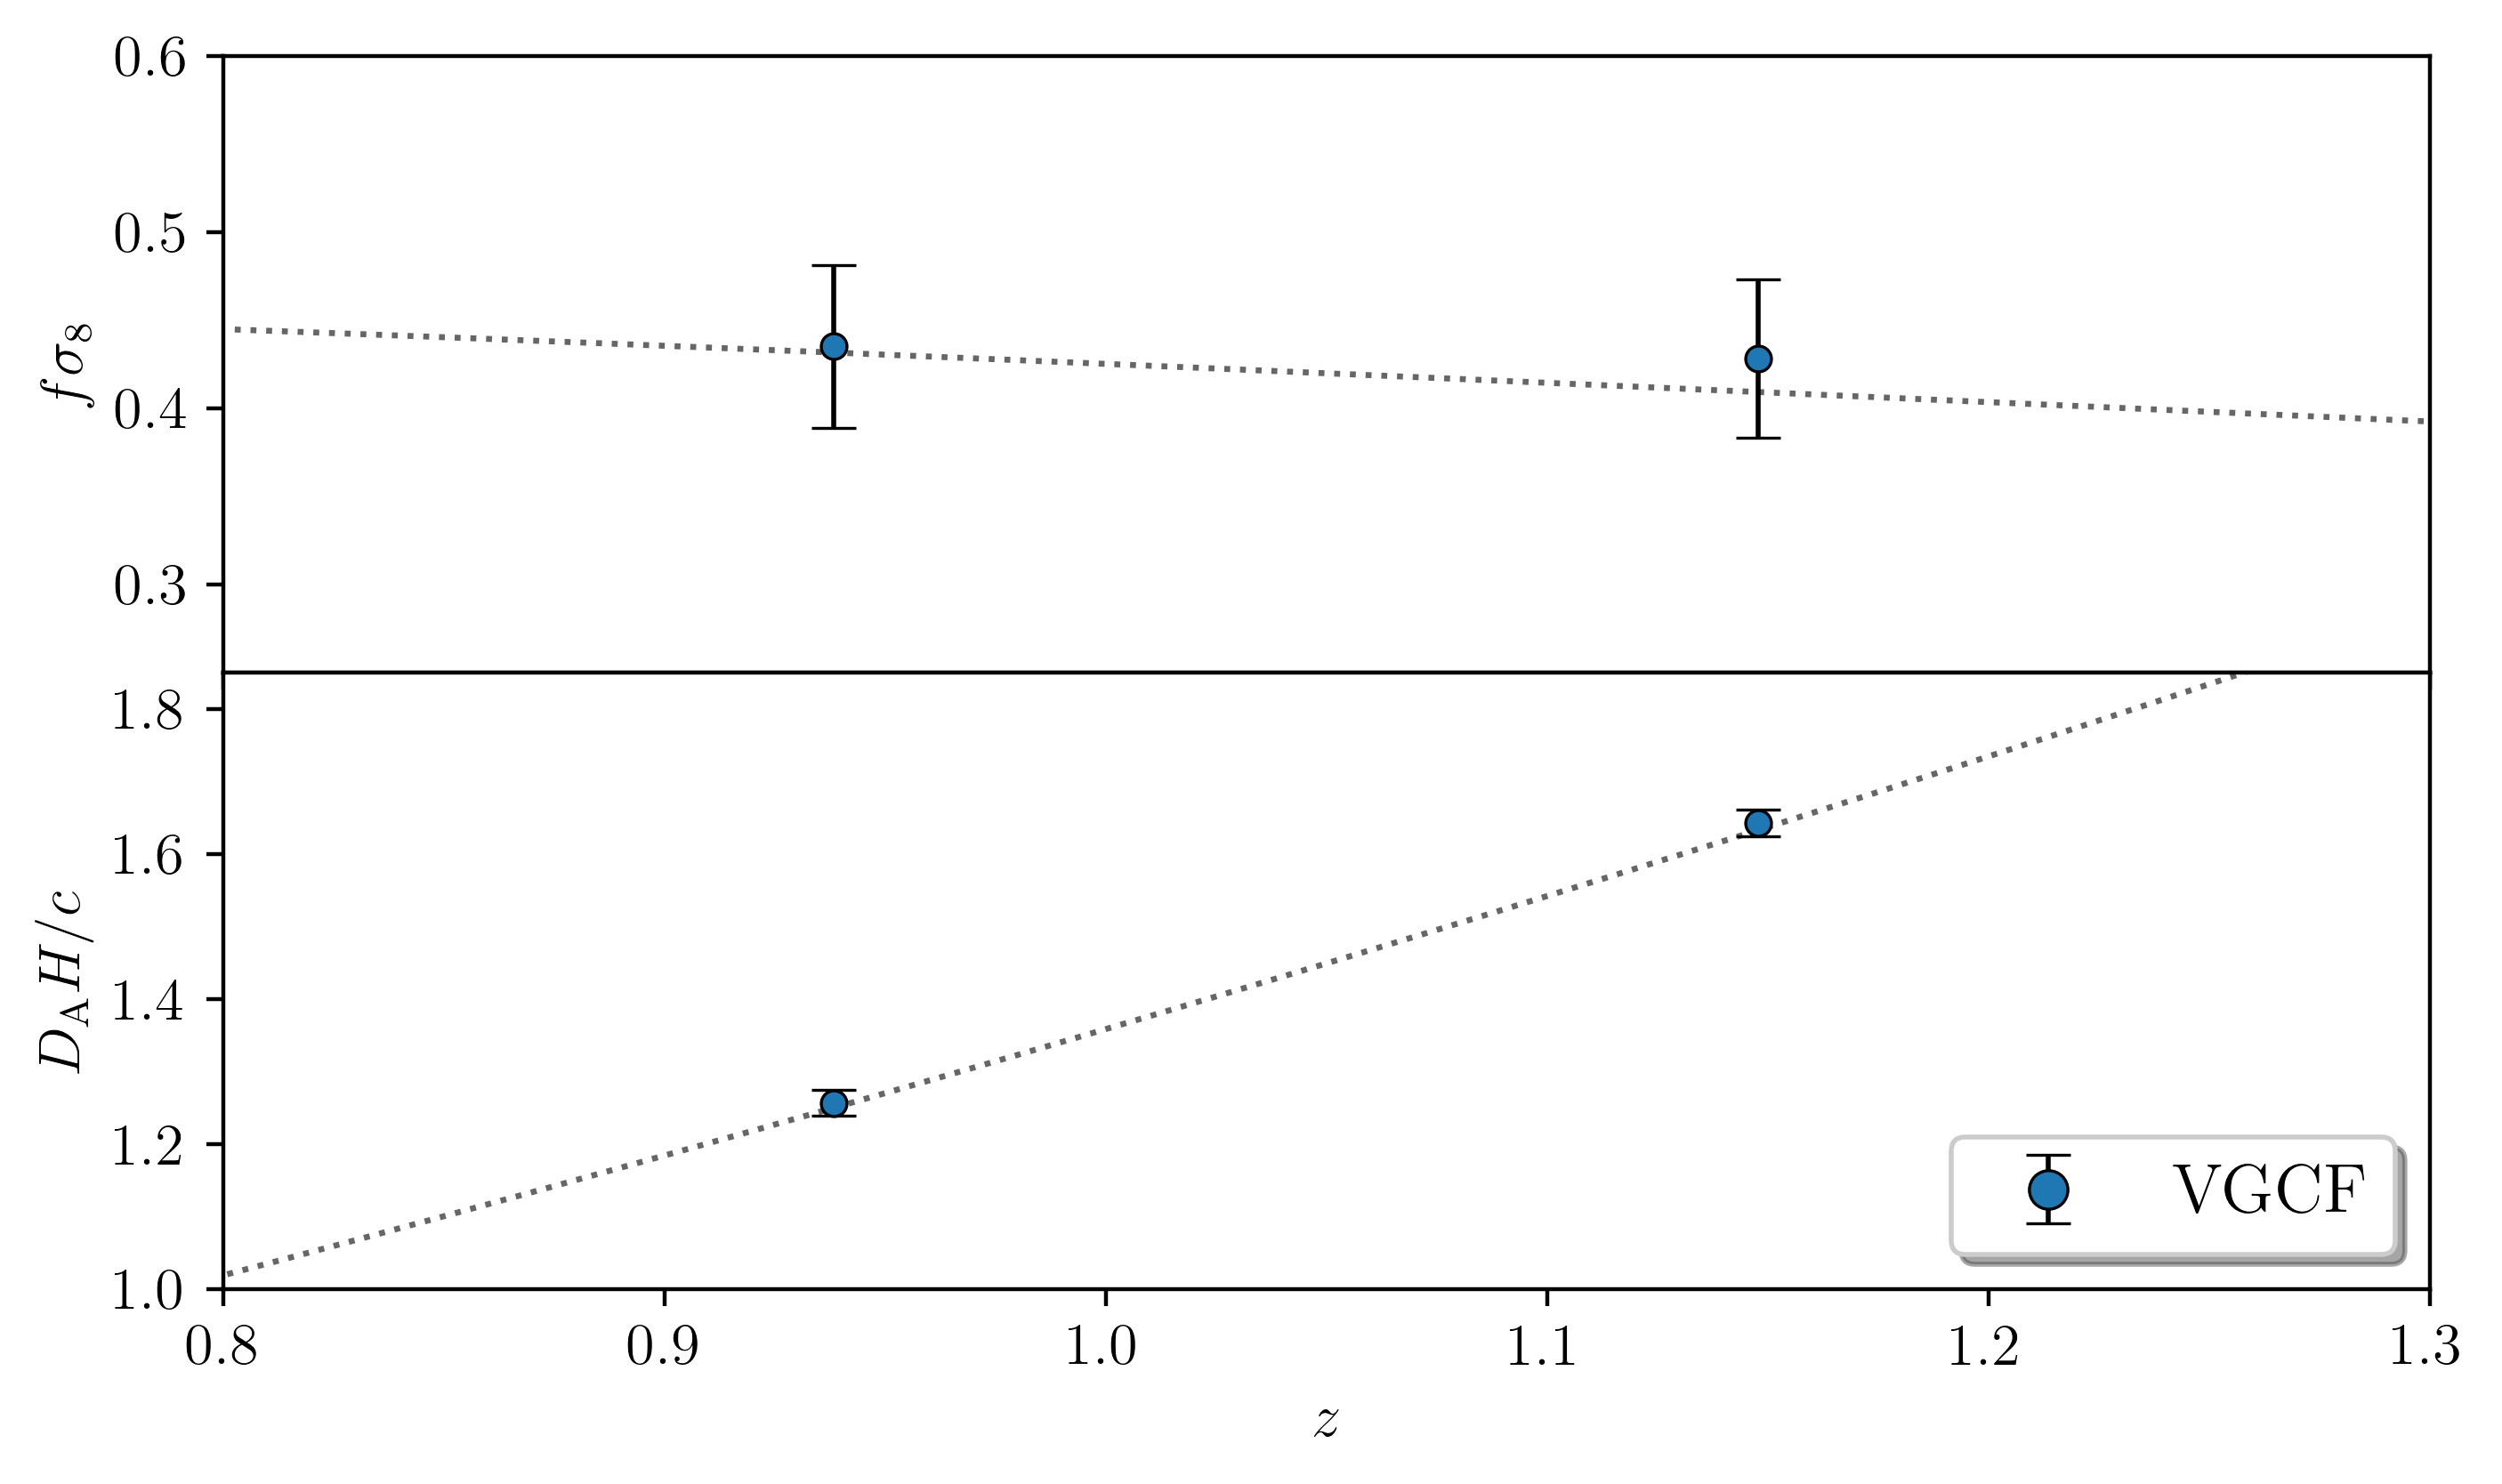
fs8_DAH: measurements of \(f\sigma_8\) and \(D_\mathrm{A}H\) as a function of redshift (fiducial model as dotted line).
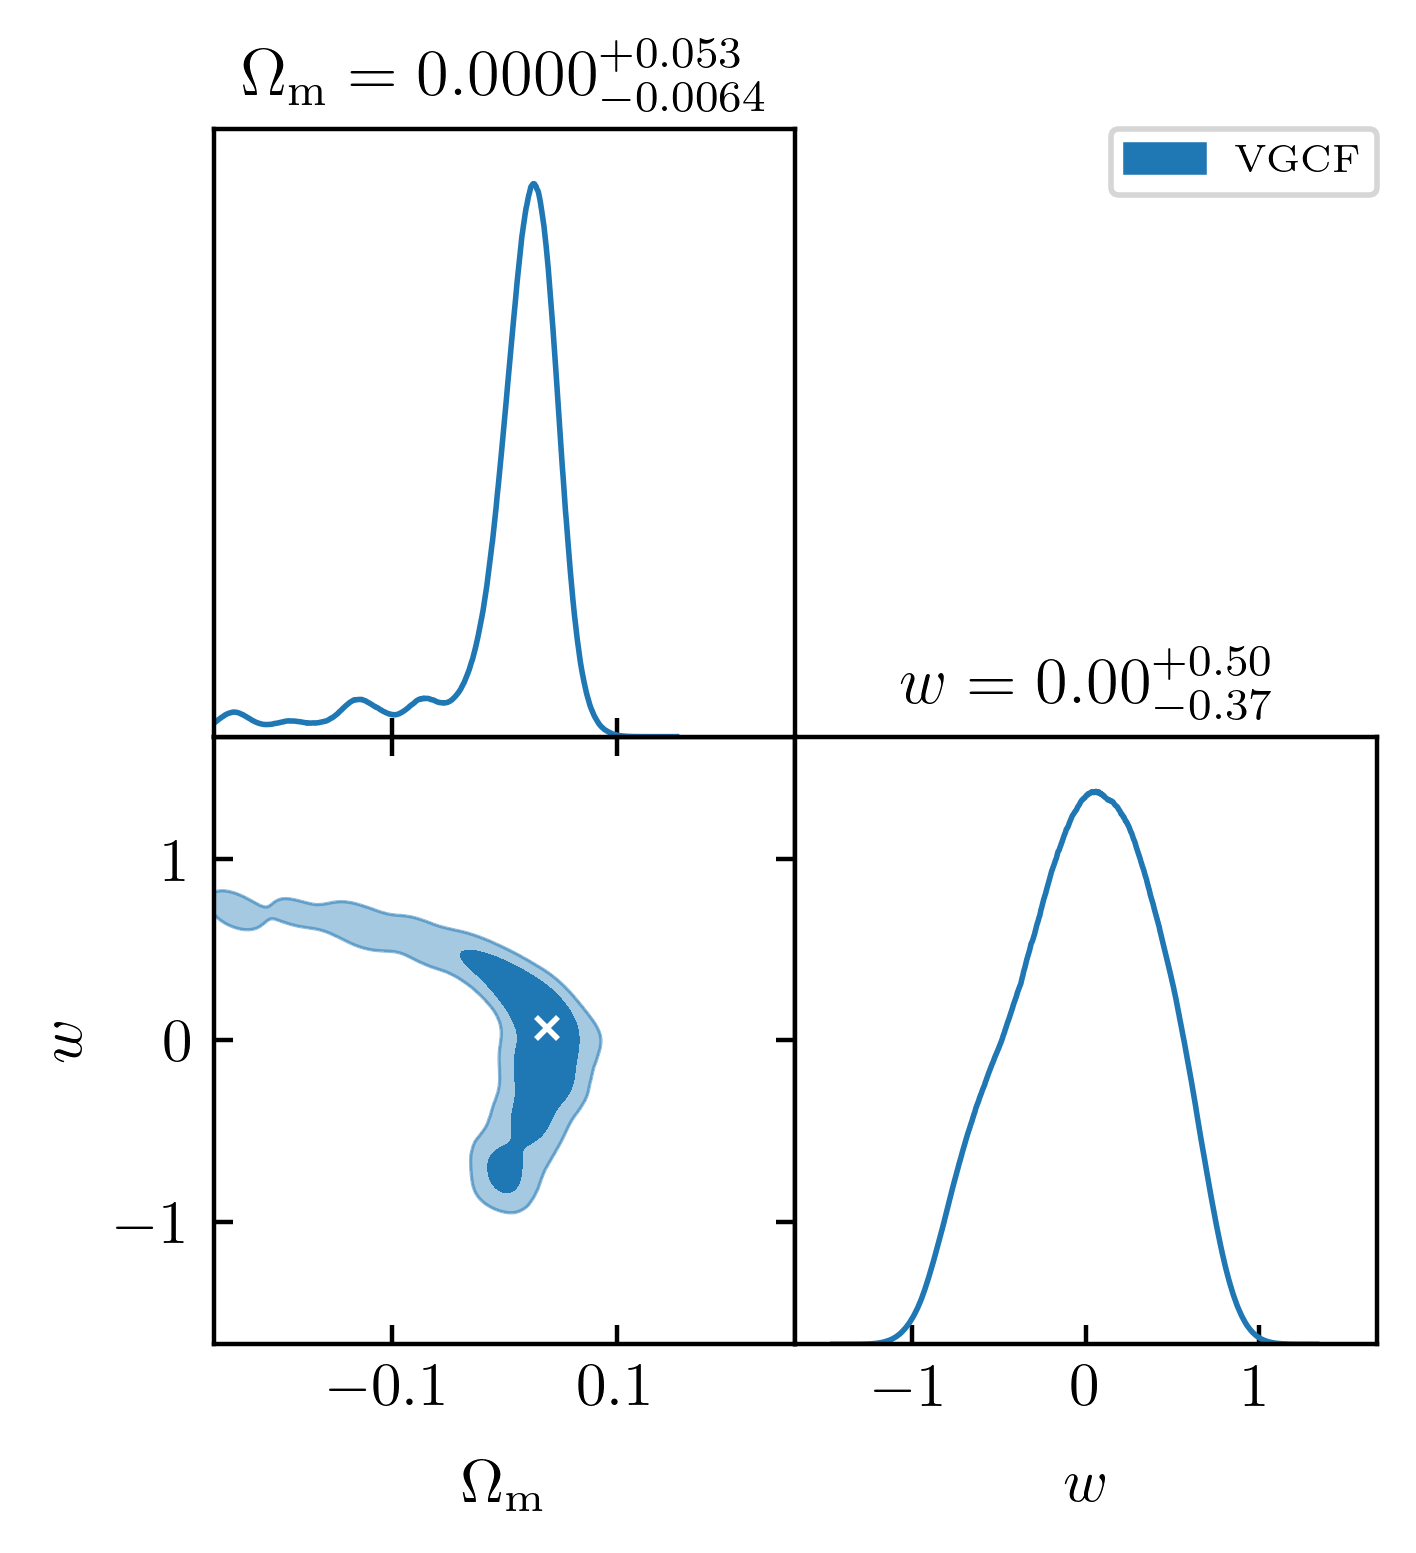
triangle_wCDM: posterior of model parameters in a wCDM cosmology (blinded by mean) with its maximum (white cross). An extended banana-shaped degeneracy emerges, which leads to projection effects in the marginalized posteriors.